United Airlines 2015 Annual Report Download - page 52
Download and view the complete annual report
Please find page 52 of the 2015 United Airlines annual report below. You can navigate through the pages in the report by either clicking on the pages listed below, or by using the keyword search tool below to find specific information within the annual report.-
 1
1 -
2
-
3
-
4
-
5
-
6
-
7
-
8
-
9
-
10
-
11
-
12
-
13
-
14
-
15
-
16
-
17
-
18
-
19
-
20
-
21
-
22
-
23
-
24
-
25
-
26
-
27
-
28
-
29
-
30
-
31
-
32
-
33
-
34
-
35
-
36
-
37
-
38
-
39
-
40
-
41
-
 42
42 -
 43
43 -
 44
44 -
 45
45 -
 46
46 -
 47
47 -
 48
48 -
 49
49 -
 50
50 -
 51
51 -
 52
52 -
 53
53 -
 54
54 -
 55
55 -
 56
56 -
 57
57 -
 58
58 -
 59
59 -
 60
60 -
 61
61 -
 62
62 -
63
-
64
-
65
-
66
-
67
-
68
-
69
-
70
-
71
-
72
-
73
-
74
-
75
-
76
-
77
-
78
-
79
-
80
-
81
-
82
-
83
-
84
-
85
-
86
-
87
-
88
-
89
-
90
-
91
-
92
-
93
-
94
-
95
-
96
-
97
-
98
-
99
-
100
-
101
-
102
-
103
-
104
-
105
-
106
-
107
-
108
-
109
-
110
-
111
-
112
-
113
-
114
-
115
-
116
-
117
-
118
-
119
-
120
-
121
-
122
-
123
-
124
-
125
-
126
-
127
-
128
-
129
-
130
-
131
-
132
-
133
-
134
-
135
-
136
-
137
-
138
-
139
-
140
-
141
-
142
-
143
-
144
-
145
-
146
-
147
-
148
-
149
-
150
-
151
-
152
-
153
-
154
-
155
-
156
-
157
-
158
-
159
-
160
-
161
-
162
-
163
-
164
-
165
-
166
-
167
-
168
-
169
-
170
-
171
-
172
-
173
-
174
 |
 |

If the prices of the underlying commodity drop and stay below specified floor prices in some hedge contracts such as fixed-price swaps and collars, the
Company may incur losses. However, the negative impact of these losses would be significantly outweighed by the benefit of lower aircraft fuel cost since the
Company typically hedges only a portion of its future fuel requirements. In addition, the Company continually monitors its portfolio of hedge contracts and
may take actions to curtail or limit its losses from such hedge contracts if market conditions change.
If fuel prices decline significantly from the levels existing at the time we enter into a hedge contract, we may be required to post collateral (margin) with our
hedge counterparties. The Company frequently monitors this margin risk and assesses the potential of depositing additional collateral with each of its
counterparties. At times, when the fair market value of the Company’s hedge contracts is net positive to the Company, it is exposed to the event of non-
performance by the counterparty to the hedge contract. The Company periodically monitors the credit worthiness of its counterparties, requires its
counterparties to post collateral above certain thresholds and generally limits its exposure to any single counterparty.
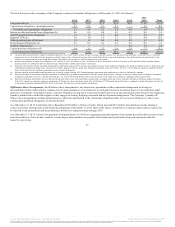
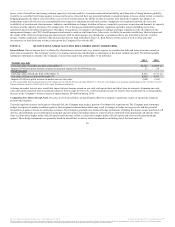
The Company may adjust its hedging program based on changes in market conditions. The following table summarizes information related to the Company’s
cost of fuel and hedging (in millions, except percentages):
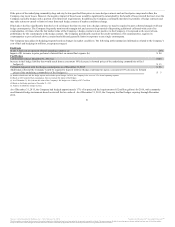
In 2015, fuel cost as a percent of total operating expenses (a) 23%
Impact of $1 increase in price per barrel of aircraft fuel on annual fuel expense (b) $ 94
Liability fair value at December 31, 2015 (c) $124
Increase in fuel hedge liability that would result from a concurrent 10% decrease in forward prices of the underlying commodities of fuel
hedges (d) $ 13
Collateral deposited with fuel hedge counterparties as of December 31, 2015 $ 26
Additional collateral the Company would be required to deposit with fuel hedge counterparties upon a concurrent 10% decrease in forward
prices of the underlying commodities of fuel hedges (e) $ 5
(a) Includes related taxes and fuel hedge impacts and excludes special charges. In 2014, the Company’s fuel cost was 32% of total operating expenses.
(b) Based on 2016 projected fuel consumption. Does not include the impact of fuel hedges.
(c) As of December 31, 2014, the net fair value of the Company’s fuel hedges was a liability of $717 million.
(d) Based on fuel hedge positions at December 31, 2015.
(e) Assumes instantaneous change in prices.
As of December 31, 2015, the Company had hedged approximately 17% of its projected fuel requirements (652 million gallons) for 2016, with commonly
used financial hedge instruments based on aircraft fuel or crude oil. As of December 31, 2015, the Company had fuel hedges expiring through December
2016.
51
Source: United Continental Holdings, Inc., 10-K, February 18, 2016 Powered by Morningstar® Document Research℠
The information contained herein may not be copied, adapted or distributed and is not warranted to be accurate, complete or timely. The user assumes all risks for any damages or losses arising from any use of this information,
except to the extent such damages or losses cannot be limited or excluded by applicable law. Past financial performance is no guarantee of future results.