United Airlines 2015 Annual Report Download - page 163
Download and view the complete annual report
Please find page 163 of the 2015 United Airlines annual report below. You can navigate through the pages in the report by either clicking on the pages listed below, or by using the keyword search tool below to find specific information within the annual report.-
 1
1 -
2
-
3
-
4
-
5
-
6
-
7
-
8
-
9
-
10
-
11
-
12
-
13
-
14
-
15
-
16
-
17
-
18
-
19
-
20
-
21
-
22
-
23
-
24
-
25
-
26
-
27
-
28
-
29
-
30
-
31
-
32
-
33
-
34
-
35
-
36
-
37
-
38
-
39
-
40
-
41
-
42
-
43
-
44
-
45
-
46
-
47
-
48
-
49
-
50
-
51
-
52
-
53
-
54
-
55
-
56
-
57
-
58
-
59
-
60
-
61
-
62
-
63
-
64
-
65
-
66
-
67
-
68
-
69
-
70
-
71
-
72
-
73
-
74
-
75
-
76
-
77
-
78
-
79
-
80
-
81
-
82
-
83
-
84
-
85
-
86
-
87
-
88
-
89
-
90
-
91
-
92
-
93
-
94
-
95
-
96
-
97
-
98
-
99
-
100
-
101
-
102
-
103
-
104
-
105
-
106
-
107
-
108
-
109
-
110
-
111
-
112
-
113
-
114
-
115
-
116
-
117
-
118
-
119
-
120
-
121
-
122
-
123
-
124
-
125
-
126
-
127
-
128
-
129
-
130
-
131
-
132
-
133
-
134
-
135
-
136
-
137
-
138
-
139
-
140
-
141
-
142
-
143
-
144
-
145
-
146
-
147
-
148
-
149
-
150
-
151
-
152
-
 153
153 -
 154
154 -
 155
155 -
 156
156 -
 157
157 -
 158
158 -
 159
159 -
 160
160 -
 161
161 -
 162
162 -
 163
163 -
 164
164 -
 165
165 -
 166
166 -
 167
167 -
 168
168 -
 169
169 -
 170
170 -
 171
171 -
 172
172 -
 173
173 -
174
 |
 |

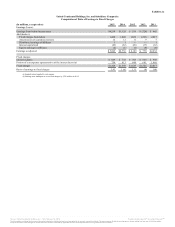
Exhibit 12.1
United Continental Holdings, Inc. and Subsidiary Companies
Computation of Ratio of Earnings to Fixed Charges
(In millions, except ratios) 2015 2014 2013 2012 2011
Earnings (losses):
Earnings (loss) before income taxes $4,219 $1,128 $ 539 $ (724) $ 845
Add (deduct):
Fixed charges, from below 1,428 1,648 1,629 1,526 2,017
Amortization of capitalized interest 12 12 11 9 7
Distributed earnings of affiliates 1 1 — — 1
Interest capitalized (49) (52) (49) (37) (32)
Equity earnings in affiliates (2) (1) (1) (4) (6)
Earnings as adjusted $ 5,609 $2,736 $ 2,129 $ 770 $2,832
Fixed charges:
Interest expense $ 669 $ 735 $ 783 $ 835 $ 949
Portion of rent expense representative of the interest factor (a) 759 913 846 691 1,068
Fixed charges $1,428 $1,648 $1,629 $1,526 $2,017
Ratio of earnings to fixed charges 3.93 1.66 1.31 (b) 1.40
(a) Imputed interest applied to rent expense.
(b) Earnings were inadequate to cover fixed charges by $756 million in 2012.
Source: United Continental Holdings, Inc., 10-K, February 18, 2016 Powered by Morningstar® Document Research℠
The information contained herein may not be copied, adapted or distributed and is not warranted to be accurate, complete or timely. The user assumes all risks for any damages or losses arising from any use of this information,
except to the extent such damages or losses cannot be limited or excluded by applicable law. Past financial performance is no guarantee of future results.