United Airlines 2015 Annual Report Download - page 37
Download and view the complete annual report
Please find page 37 of the 2015 United Airlines annual report below. You can navigate through the pages in the report by either clicking on the pages listed below, or by using the keyword search tool below to find specific information within the annual report.-
 1
1 -
2
-
3
-
4
-
5
-
6
-
7
-
8
-
9
-
10
-
11
-
12
-
13
-
14
-
15
-
16
-
17
-
18
-
19
-
20
-
21
-
22
-
23
-
24
-
25
-
26
-
 27
27 -
 28
28 -
 29
29 -
 30
30 -
 31
31 -
 32
32 -
 33
33 -
 34
34 -
 35
35 -
 36
36 -
 37
37 -
 38
38 -
 39
39 -
 40
40 -
 41
41 -
 42
42 -
 43
43 -
 44
44 -
 45
45 -
 46
46 -
 47
47 -
48
-
49
-
50
-
51
-
52
-
53
-
54
-
55
-
56
-
57
-
58
-
59
-
60
-
61
-
62
-
63
-
64
-
65
-
66
-
67
-
68
-
69
-
70
-
71
-
72
-
73
-
74
-
75
-
76
-
77
-
78
-
79
-
80
-
81
-
82
-
83
-
84
-
85
-
86
-
87
-
88
-
89
-
90
-
91
-
92
-
93
-
94
-
95
-
96
-
97
-
98
-
99
-
100
-
101
-
102
-
103
-
104
-
105
-
106
-
107
-
108
-
109
-
110
-
111
-
112
-
113
-
114
-
115
-
116
-
117
-
118
-
119
-
120
-
121
-
122
-
123
-
124
-
125
-
126
-
127
-
128
-
129
-
130
-
131
-
132
-
133
-
134
-
135
-
136
-
137
-
138
-
139
-
140
-
141
-
142
-
143
-
144
-
145
-
146
-
147
-
148
-
149
-
150
-
151
-
152
-
153
-
154
-
155
-
156
-
157
-
158
-
159
-
160
-
161
-
162
-
163
-
164
-
165
-
166
-
167
-
168
-
169
-
170
-
171
-
172
-
173
-
174
 |
 |

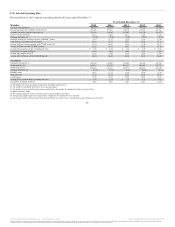
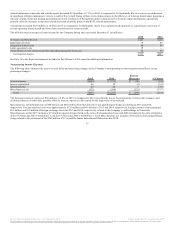
Operating Revenue
The table below illustrates the year-over-year percentage change in the Company’s operating revenues for the years ended December 31 (in millions, except
percentage changes):
Passenger—Mainline $26,785 $25,997 $ 788 3.0
Passenger—Regional 6,977 7,125 (148) (2.1)
Total passenger revenue 33,762 33,122 640 1.9
Cargo 938 882 56 6.3
Other operating revenue 4,201 4,275 (74) (1.7)
$38,901 $38,279 $ 622 1.6
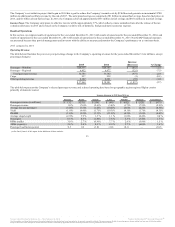
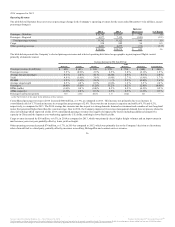
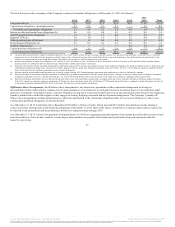
The table below presents the Company’s selected passenger revenue and selected operating data based on geographic region (regional flights consist
primarily of domestic routes):
Passenger revenue (in millions) $ 490 $ (41) $ 169 $ 170 $ 788 $ (148) $ 640
Passenger revenue 3.9 % (0.9)% 2.9 % 6.5 % 3.0 % (2.1)% 1.9 %
Average fare per passenger 4.7 % 2.2 % 4.1 % (4.2)% 2.9 % 0.7 % 2.8 %
Yield 4.9 % (1.6)% 3.6 % (1.9)% 2.7 % (1.9)% 1.7 %
PRASM 5.2 % (3.6)% 2.6 % — % 2.5 % (0.8)% 1.6 %
Average stage length 0.5 % 4.8 % 0.9 % (1.8)% 1.2 % 3.5 % 2.4 %
Passengers (0.8)% (3.0)% (1.2)% 11.2 % 0.2 % (2.8)% (0.8)%
RPMs (traffic) (1.0)% 0.8 % (0.8)% 8.5 % 0.2 % (0.2)% 0.2 %
ASMs (capacity) (1.3)% 2.8 % 0.3 % 6.5 % 0.5 % (1.3)% 0.3 %
Passenger load factor (points) 0.3 (1.6) (0.8) 1.5 (0.2) 1.0 —
(a) See Part II, Item 6 of this report for the definition of these statistics.
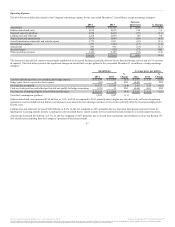
Consolidated passenger revenue in 2014 increased $640 million, or 1.9%, as compared to 2013. This increase was primarily due to an increase in
consolidated yield of 1.7% and an increase in average fare per passenger of 2.8%. There was also an increase in capacity and traffic of 0.3% and 0.2%,
respectively, as compared to 2013. The 2014 average fare increase was due in part to a strong domestic demand environment and a number of new long-haul
routes that generated higher fares than the system average. Also in 2014, the Company improved its revenue management demand forecast process related to
close-in bookings which improved yields. 2013 consolidated passenger revenue was negatively impacted by factors including additional competitive
capacity in China and the Japanese yen weakening against the U.S. dollar, resulting in lower Pacific yields.
Cargo revenue increased by $56 million, or 6.3%, in 2014 as compared to 2013, which was primarily due to higher freight volumes and an improvement in
mail revenue year-over-year, partially offset by lower yield on freight.
Other operating revenue decreased $74 million, or 1.7%, in 2014 as compared to 2013, which was primarily due to the Company’s decision to discontinue
sales of aircraft fuel to a third party, partially offset by increases in ancillary, MileagePlus and contract services revenue.
36
Source: United Continental Holdings, Inc., 10-K, February 18, 2016 Powered by Morningstar® Document Research℠
The information contained herein may not be copied, adapted or distributed and is not warranted to be accurate, complete or timely. The user assumes all risks for any damages or losses arising from any use of this information,
except to the extent such damages or losses cannot be limited or excluded by applicable law. Past financial performance is no guarantee of future results.