United Airlines 2015 Annual Report Download - page 89
Download and view the complete annual report
Please find page 89 of the 2015 United Airlines annual report below. You can navigate through the pages in the report by either clicking on the pages listed below, or by using the keyword search tool below to find specific information within the annual report.
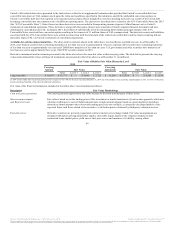
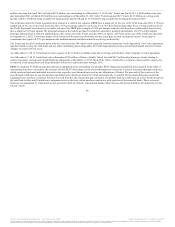
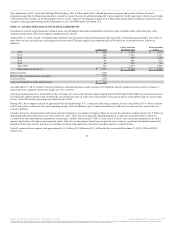
Fair Value Information. Accounting standards require us to use valuation techniques to measure fair value that maximize the use of observable inputs and
minimize the use of unobservable inputs. These inputs are described in Note 8 of this report. The table below presents disclosures about the fair value of
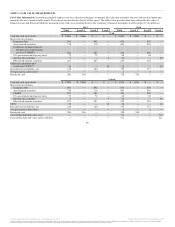
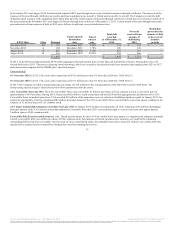
financial assets and financial liabilities measured at fair value on a recurring basis in the Company’s financial statements as of December 31 (in millions):
Cash and cash equivalents $ 3,006 $ 3,006 $ — $ — $ 2,002 $ 2,002 $ — $ —
Short-term investments:
Corporate debt 891 — 891 — 876 — 876 —
Asset-backed securities 710 — 710 — 901 — 901 —
Certificates of deposit placed
through an account registry
service (“CDARS”) 281 — 281 — 256 — 256 —
U.S. government and agency notes 72 — 72 — 68 — 68 —
Auction rate securities 9 — — 9 26 — — 26
Other fixed-income securities 227 — 227 — 255 — 255 —
Enhanced equipment trust
certificates (“EETC”) 26 — — 26 28 — — 28
Fuel derivatives liability, net 124 — 124 — 717 — 717 —
Foreign currency derivatives — — — — 2 — 2 —
Restricted cash 206 206 — — 320 320 — —
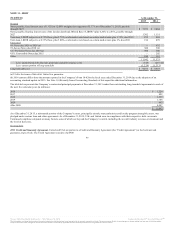
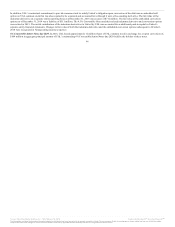
Cash and cash equivalents $ 3,000 $ 3,000 $ — $ — $ 1,996 $ 1,996 $ — $ —
Short-term investments:
Corporate debt 891 — 891 — 876 — 876 —
Asset-backed securities 710 — 710 — 901 — 901 —
CDARS 281 — 281 — 256 — 256 —
U.S. government and agency notes 72 — 72 — 68 — 68 —
Auction rate securities 9 — — 9 26 — — 26
Other fixed-income securities 227 — 227 — 255 — 255 —
EETC 26 — — 26 28 — — 28
Fuel derivatives liability, net 124 — 124 — 717 — 717 —
Foreign currency derivatives — — — — 2 — 2 —
Restricted cash 206 206 — — 320 320 — —
Convertible debt derivative asset — — — — 712 — — 712
Convertible debt derivative option liability — — — — 511 — — 511
88
Source: United Continental Holdings, Inc., 10-K, February 18, 2016 Powered by Morningstar® Document Research℠
The information contained herein may not be copied, adapted or distributed and is not warranted to be accurate, complete or timely. The user assumes all risks for any damages or losses arising from any use of this information,
except to the extent such damages or losses cannot be limited or excluded by applicable law. Past financial performance is no guarantee of future results.


