United Airlines 2015 Annual Report Download - page 77
Download and view the complete annual report
Please find page 77 of the 2015 United Airlines annual report below. You can navigate through the pages in the report by either clicking on the pages listed below, or by using the keyword search tool below to find specific information within the annual report.-
 1
1 -
2
-
3
-
4
-
5
-
6
-
7
-
8
-
9
-
10
-
11
-
12
-
13
-
14
-
15
-
16
-
17
-
18
-
19
-
20
-
21
-
22
-
23
-
24
-
25
-
26
-
27
-
28
-
29
-
30
-
31
-
32
-
33
-
34
-
35
-
36
-
37
-
38
-
39
-
40
-
41
-
42
-
43
-
44
-
45
-
46
-
47
-
48
-
49
-
50
-
51
-
52
-
53
-
54
-
55
-
56
-
57
-
58
-
59
-
60
-
61
-
62
-
63
-
64
-
65
-
66
-
 67
67 -
 68
68 -
 69
69 -
 70
70 -
 71
71 -
 72
72 -
 73
73 -
 74
74 -
 75
75 -
 76
76 -
 77
77 -
 78
78 -
 79
79 -
 80
80 -
 81
81 -
 82
82 -
 83
83 -
 84
84 -
 85
85 -
 86
86 -
 87
87 -
88
-
89
-
90
-
91
-
92
-
93
-
94
-
95
-
96
-
97
-
98
-
99
-
100
-
101
-
102
-
103
-
104
-
105
-
106
-
107
-
108
-
109
-
110
-
111
-
112
-
113
-
114
-
115
-
116
-
117
-
118
-
119
-
120
-
121
-
122
-
123
-
124
-
125
-
126
-
127
-
128
-
129
-
130
-
131
-
132
-
133
-
134
-
135
-
136
-
137
-
138
-
139
-
140
-
141
-
142
-
143
-
144
-
145
-
146
-
147
-
148
-
149
-
150
-
151
-
152
-
153
-
154
-
155
-
156
-
157
-
158
-
159
-
160
-
161
-
162
-
163
-
164
-
165
-
166
-
167
-
168
-
169
-
170
-
171
-
172
-
173
-
174
 |
 |

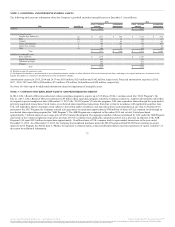
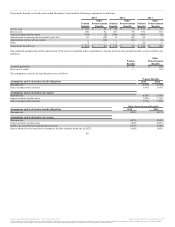
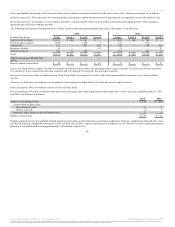
The table below summarizes UAL’s RSUs and restricted stock activity for the years ended December 31 (shares in millions):
Non-vested at December 31, 2012 4.3 0.8 $ 23.94
Granted 1.8 0.5 25.98
Vested (0.5) (0.3) 23.93
Forfeited (0.2) (0.1) 24.76
Non-vested at December 31, 2013 5.4 0.9 25.02
Granted 0.9 0.3 43.33
Vested (2.2) (0.4) 24.66
Forfeited (0.3) (0.1) 28.88
Non-vested at December 31, 2014 3.8 0.7 32.55
Granted 1.0 0.2 66.53
Vested (1.6) (0.4) 31.14
Forfeited (0.6) (0.2) 46.23
Non-vested at December 31, 2015 2.6 0.3 48.68
The fair value of RSUs and restricted stock that vested in 2015, 2014 and 2013 was $92 million, $97 million and $22 million, respectively. The fair value of
the restricted stock awards was based upon the UAL common stock price on the date of grant. These awards are accounted for as equity awards. The fair value
of the RSUs was based on the UAL common stock price as of the last day preceding the settlement date. These awards were accounted for as liability awards.
Restricted stock vesting and the recognition of the expense is similar to the stock option vesting described below.
Stock Options. UAL has not granted any stock options since 2010. Historically, stock options were awarded with exercise prices equal to the fair market
value of UAL’s common stock on the date of grant. UAL stock options generally vested over a period of either three or four years and have a contractual life
of 10 years. Expense related to each portion of an option grant was recognized on a straight-line basis over the specific vesting period for those options. The
Company determined the fair value of stock options at the grant date using a Black Scholes option pricing model. As of December 31, 2015, there were less
than 0.5 million outstanding stock option awards, all of which were exercisable, with a weighted-average exercise price of $26.80.
76
Source: United Continental Holdings, Inc., 10-K, February 18, 2016 Powered by Morningstar® Document Research℠
The information contained herein may not be copied, adapted or distributed and is not warranted to be accurate, complete or timely. The user assumes all risks for any damages or losses arising from any use of this information,
except to the extent such damages or losses cannot be limited or excluded by applicable law. Past financial performance is no guarantee of future results.