United Airlines 2015 Annual Report Download - page 85
Download and view the complete annual report
Please find page 85 of the 2015 United Airlines annual report below. You can navigate through the pages in the report by either clicking on the pages listed below, or by using the keyword search tool below to find specific information within the annual report.-
 1
1 -
2
-
3
-
4
-
5
-
6
-
7
-
8
-
9
-
10
-
11
-
12
-
13
-
14
-
15
-
16
-
17
-
18
-
19
-
20
-
21
-
22
-
23
-
24
-
25
-
26
-
27
-
28
-
29
-
30
-
31
-
32
-
33
-
34
-
35
-
36
-
37
-
38
-
39
-
40
-
41
-
42
-
43
-
44
-
45
-
46
-
47
-
48
-
49
-
50
-
51
-
52
-
53
-
54
-
55
-
56
-
57
-
58
-
59
-
60
-
61
-
62
-
63
-
64
-
65
-
66
-
67
-
68
-
69
-
70
-
71
-
72
-
73
-
74
-
 75
75 -
 76
76 -
 77
77 -
 78
78 -
 79
79 -
 80
80 -
 81
81 -
 82
82 -
 83
83 -
 84
84 -
 85
85 -
 86
86 -
 87
87 -
 88
88 -
 89
89 -
 90
90 -
 91
91 -
 92
92 -
 93
93 -
 94
94 -
 95
95 -
96
-
97
-
98
-
99
-
100
-
101
-
102
-
103
-
104
-
105
-
106
-
107
-
108
-
109
-
110
-
111
-
112
-
113
-
114
-
115
-
116
-
117
-
118
-
119
-
120
-
121
-
122
-
123
-
124
-
125
-
126
-
127
-
128
-
129
-
130
-
131
-
132
-
133
-
134
-
135
-
136
-
137
-
138
-
139
-
140
-
141
-
142
-
143
-
144
-
145
-
146
-
147
-
148
-
149
-
150
-
151
-
152
-
153
-
154
-
155
-
156
-
157
-
158
-
159
-
160
-
161
-
162
-
163
-
164
-
165
-
166
-
167
-
168
-
169
-
170
-
171
-
172
-
173
-
174
 |
 |

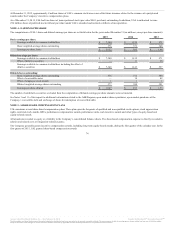
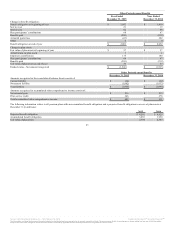
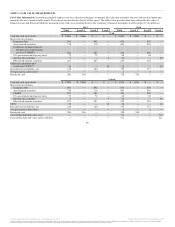
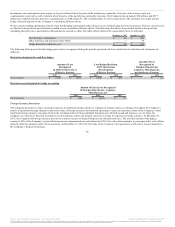
Net periodic benefit cost for the years ended December 31 included the following components (in millions):
Service cost $ 124 $ 21 $ 98 $ 19 $ 121 $ 52
Interest cost 200 82 201 88 191 110
Expected return on plan assets (194) (2) (180) (2) (163) (2)
Amortization of unrecognized actuarial (gain) loss 85 (22) 12 (47) 48 3
Amortization of prior service credits — (32) — (31) — (3)
Other 4 — 1 — (8) 2
Net periodic benefit cost $ 219 $ 47 $ 132 $ 27 $ 189 $ 162
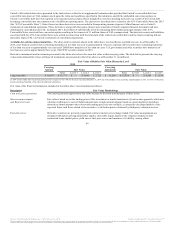
The estimated amounts that will be amortized in 2016 out of accumulated other comprehensive income (loss) into net periodic benefit cost are as follows (in
millions):
Actuarial (gain) loss $ 71 $ (22)
Prior service credit — (32)
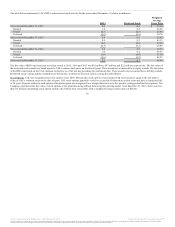
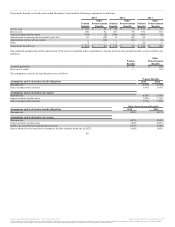
The assumptions used for the benefit plans were as follows:
Discount rate 4.58% 4.20%
Rate of compensation increase 3.66% 3.66%
Discount rate 4.20% 5.10%
Expected return on plan assets 7.40% 7.36%
Rate of compensation increase 3.51% 3.50%
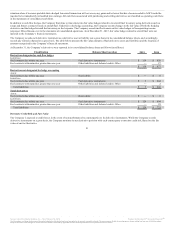
Discount rate 4.49% 4.07%
Discount rate 4.07% 4.94%
Expected return on plan assets 3.00% 4.00%
Health care cost trend rate assumed for next year 6.75% 7.00%
Rate to which the cost trend rate is assumed to decline (ultimate trend rate in 2023) 5.00% 5.00%
84
Source: United Continental Holdings, Inc., 10-K, February 18, 2016 Powered by Morningstar® Document Research℠
The information contained herein may not be copied, adapted or distributed and is not warranted to be accurate, complete or timely. The user assumes all risks for any damages or losses arising from any use of this information,
except to the extent such damages or losses cannot be limited or excluded by applicable law. Past financial performance is no guarantee of future results.