United Airlines 2015 Annual Report Download - page 31
Download and view the complete annual report
Please find page 31 of the 2015 United Airlines annual report below. You can navigate through the pages in the report by either clicking on the pages listed below, or by using the keyword search tool below to find specific information within the annual report.-
 1
1 -
2
-
3
-
4
-
5
-
6
-
7
-
8
-
9
-
10
-
11
-
12
-
13
-
14
-
15
-
16
-
17
-
18
-
19
-
20
-
 21
21 -
 22
22 -
 23
23 -
 24
24 -
 25
25 -
 26
26 -
 27
27 -
 28
28 -
 29
29 -
 30
30 -
 31
31 -
 32
32 -
 33
33 -
 34
34 -
 35
35 -
 36
36 -
 37
37 -
 38
38 -
 39
39 -
 40
40 -
 41
41 -
42
-
43
-
44
-
45
-
46
-
47
-
48
-
49
-
50
-
51
-
52
-
53
-
54
-
55
-
56
-
57
-
58
-
59
-
60
-
61
-
62
-
63
-
64
-
65
-
66
-
67
-
68
-
69
-
70
-
71
-
72
-
73
-
74
-
75
-
76
-
77
-
78
-
79
-
80
-
81
-
82
-
83
-
84
-
85
-
86
-
87
-
88
-
89
-
90
-
91
-
92
-
93
-
94
-
95
-
96
-
97
-
98
-
99
-
100
-
101
-
102
-
103
-
104
-
105
-
106
-
107
-
108
-
109
-
110
-
111
-
112
-
113
-
114
-
115
-
116
-
117
-
118
-
119
-
120
-
121
-
122
-
123
-
124
-
125
-
126
-
127
-
128
-
129
-
130
-
131
-
132
-
133
-
134
-
135
-
136
-
137
-
138
-
139
-
140
-
141
-
142
-
143
-
144
-
145
-
146
-
147
-
148
-
149
-
150
-
151
-
152
-
153
-
154
-
155
-
156
-
157
-
158
-
159
-
160
-
161
-
162
-
163
-
164
-
165
-
166
-
167
-
168
-
169
-
170
-
171
-
172
-
173
-
174
 |
 |
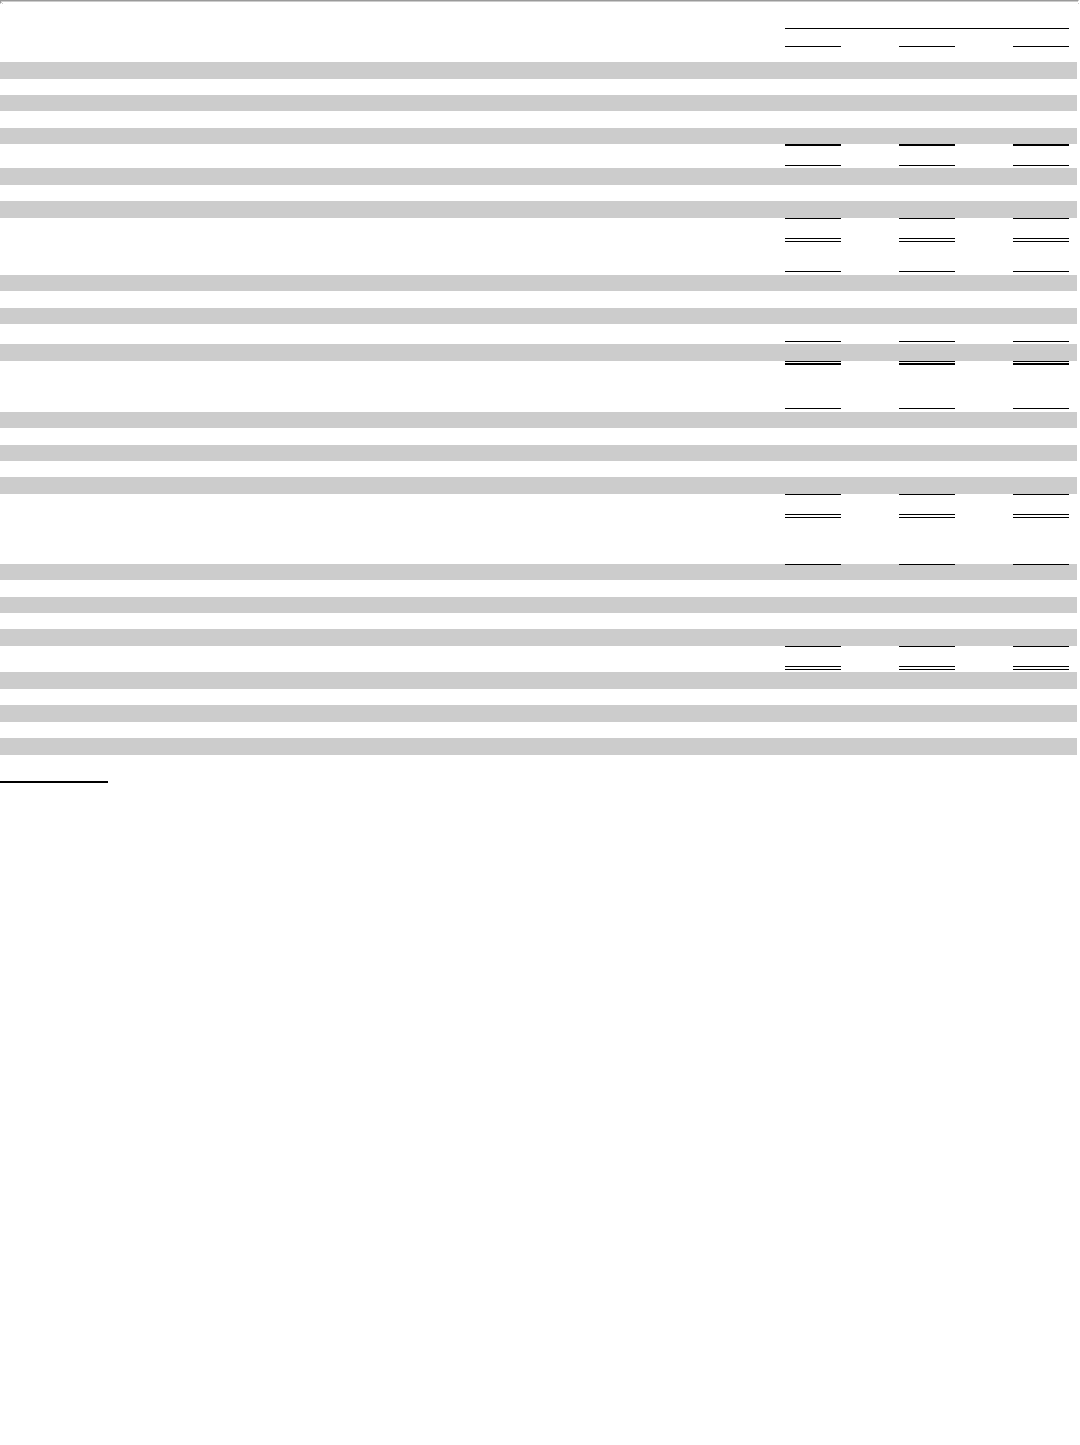
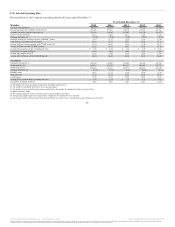
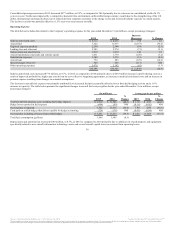
Severance and benefit costs $ 107 $ 199 $ 105
Impairment of assets 79 49 33
Integration-related costs 60 96 205
Labor agreement costs 18 — 127
(Gains) losses on sale of assets and other miscellaneous (gains) losses, net 62 99 50
Special operating expense 326 443 520
Loss on extinguishment of debt and other, net 202 74 —
Income tax benefit related to special charges (11) (10) (7)
Income tax benefit associated with valuation allowance release (3,130) — —
Total operating and nonoperating special items, net of income taxes (a) $ (2,613) $ 507 $ 513
Net income—GAAP $ 7,340 $ 1,132 $ 571
Operating and nonoperating special items, net (2,613) 507 513
MTM (gains) losses from fuel derivative contracts settling in future periods (8) 244 (84)
Prior period gains (losses) on fuel derivative contracts settled in the current period (241) 83 39
Net income excluding operating and nonoperating special items, net and reflecting Hedge Program Adjustments—Non-GAAP $ 4,478 $ 1,966 $ 1,039
Diluted earnings per share—GAAP $ 19.47 $ 2.93 $ 1.53
Operating and nonoperating special items, net (6.93) 1.29 1.31
MTM (gains) losses from fuel derivative contracts settling in future periods (0.02) 0.62 (0.21)
Prior period gains (losses) on fuel derivative contracts settled in the current period (0.64) 0.21 0.10
Impact of dilution — 0.01 —
Diluted earnings per share excluding operating and nonoperating special items, net and reflecting Hedge Program Adjustments—Non-GAAP $ 11.88 $ 5.06 $ 2.73
Operating expense $ 32,698 $ 36,528 $ 37,030
Special charges 326 443 520
Third-party business expenses 291 534 694
Aircraft fuel and related taxes 7,522 11,675 12,345
Profit sharing 698 235 190
Operating expense excluding above items $ 23,861 $ 23,641 $ 23,281
ASMs—consolidated 250,003 246,021 245,354
CASM 13.08 14.85 15.09
CASM, excluding special charges 12.95 14.67 14.88
CASM, excluding special charges and third-party business expenses 12.83 14.45 14.60
CASM, excluding special charges, third-party business expenses and fuel 9.82 9.70 9.57
CASM, excluding special charges, third-party business expenses, fuel and profit sharing 9.54 9.61 9.49
(a)See Note 16 to the financial statements included in Part II, Item 8 of this report for additional information.
30
Source: United Continental Holdings, Inc., 10-K, February 18, 2016 Powered by Morningstar® Document Research℠
The information contained herein may not be copied, adapted or distributed and is not warranted to be accurate, complete or timely. The user assumes all risks for any damages or losses arising from any use of this information,
except to the extent such damages or losses cannot be limited or excluded by applicable law. Past financial performance is no guarantee of future results.