United Airlines 2015 Annual Report Download - page 108
Download and view the complete annual report
Please find page 108 of the 2015 United Airlines annual report below. You can navigate through the pages in the report by either clicking on the pages listed below, or by using the keyword search tool below to find specific information within the annual report.-
 1
1 -
2
-
3
-
4
-
5
-
6
-
7
-
8
-
9
-
10
-
11
-
12
-
13
-
14
-
15
-
16
-
17
-
18
-
19
-
20
-
21
-
22
-
23
-
24
-
25
-
26
-
27
-
28
-
29
-
30
-
31
-
32
-
33
-
34
-
35
-
36
-
37
-
38
-
39
-
40
-
41
-
42
-
43
-
44
-
45
-
46
-
47
-
48
-
49
-
50
-
51
-
52
-
53
-
54
-
55
-
56
-
57
-
58
-
59
-
60
-
61
-
62
-
63
-
64
-
65
-
66
-
67
-
68
-
69
-
70
-
71
-
72
-
73
-
74
-
75
-
76
-
77
-
78
-
79
-
80
-
81
-
82
-
83
-
84
-
85
-
86
-
87
-
88
-
89
-
90
-
91
-
92
-
93
-
94
-
95
-
96
-
97
-
 98
98 -
 99
99 -
 100
100 -
 101
101 -
 102
102 -
 103
103 -
 104
104 -
 105
105 -
 106
106 -
 107
107 -
 108
108 -
 109
109 -
 110
110 -
 111
111 -
 112
112 -
 113
113 -
 114
114 -
 115
115 -
 116
116 -
 117
117 -
 118
118 -
119
-
120
-
121
-
122
-
123
-
124
-
125
-
126
-
127
-
128
-
129
-
130
-
131
-
132
-
133
-
134
-
135
-
136
-
137
-
138
-
139
-
140
-
141
-
142
-
143
-
144
-
145
-
146
-
147
-
148
-
149
-
150
-
151
-
152
-
153
-
154
-
155
-
156
-
157
-
158
-
159
-
160
-
161
-
162
-
163
-
164
-
165
-
166
-
167
-
168
-
169
-
170
-
171
-
172
-
173
-
174
 |
 |

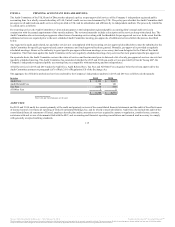
Operating segments are defined as components of an enterprise with separate financial information, which are evaluated regularly by the chief operating
decision maker and are used in resource allocation and performance assessments.
The Company deploys its aircraft across its route network through a single route scheduling system to maximize its value. When making resource allocation
decisions, the Company’s chief operating decision maker evaluates flight profitability data, which considers aircraft type and route economics. The
Company’s chief operating decision maker makes resource allocation decisions to maximize the Company’s consolidated financial results. Managing the
Company as one segment allows management the opportunity to maximize the value of its route network.
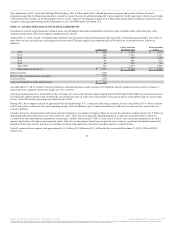
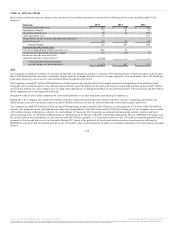
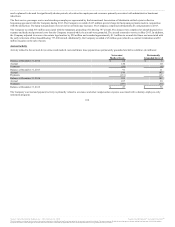
The Company’s operating revenue by principal geographic region (as defined by the U.S. Department of Transportation) for the years ended December 31 is
presented in the table below (in millions):
Domestic (U.S. and Canada) $ 21,931
Pacific 5,498
Atlantic 7,068
Latin America 3,367
Total $ 37,864
Domestic (U.S. and Canada) $ 22,320
Pacific 5,767
Atlantic 7,321
Latin America 3,493
Total $ 38,901
Domestic (U.S. and Canada) $ 22,092
Pacific 5,794
Atlantic 7,132
Latin America 3,261
Total $ 38,279 (a)
(a) UAL and United amounts are substantially the same.
The Company attributes revenue among the geographic areas based upon the origin and destination of each flight segment. The Company’s operations
involve an insignificant level of dedicated revenue-producing assets in geographic regions as the overwhelming majority of the Company’s revenue
producing assets (primarily U.S. registered aircraft) can be deployed in any of its geographic regions.
107
Source: United Continental Holdings, Inc., 10-K, February 18, 2016 Powered by Morningstar® Document Research℠
The information contained herein may not be copied, adapted or distributed and is not warranted to be accurate, complete or timely. The user assumes all risks for any damages or losses arising from any use of this information,
except to the extent such damages or losses cannot be limited or excluded by applicable law. Past financial performance is no guarantee of future results.