Time Warner Cable 2012 Annual Report Download - page 83
Download and view the complete annual report
Please find page 83 of the 2012 Time Warner Cable annual report below. You can navigate through the pages in the report by either clicking on the pages listed below, or by using the keyword search tool below to find specific information within the annual report.-
 1
1 -
2
-
3
-
4
-
5
-
6
-
7
-
8
-
9
-
10
-
11
-
12
-
13
-
14
-
15
-
16
-
17
-
18
-
19
-
20
-
21
-
22
-
23
-
24
-
25
-
26
-
27
-
28
-
29
-
30
-
31
-
32
-
33
-
34
-
35
-
36
-
37
-
38
-
39
-
40
-
41
-
42
-
43
-
44
-
45
-
46
-
47
-
48
-
49
-
50
-
51
-
52
-
53
-
54
-
55
-
56
-
57
-
58
-
59
-
60
-
61
-
62
-
63
-
64
-
65
-
66
-
67
-
68
-
69
-
70
-
71
-
72
-
 73
73 -
 74
74 -
 75
75 -
 76
76 -
 77
77 -
 78
78 -
 79
79 -
 80
80 -
 81
81 -
 82
82 -
 83
83 -
 84
84 -
 85
85 -
 86
86 -
 87
87 -
 88
88 -
 89
89 -
 90
90 -
 91
91 -
 92
92 -
 93
93 -
94
-
95
-
96
-
97
-
98
-
99
-
100
-
101
-
102
-
103
-
104
-
105
-
106
-
107
-
108
-
109
-
110
-
111
-
112
-
113
-
114
-
115
-
116
-
117
-
118
-
119
-
120
-
121
-
122
-
123
-
124
-
125
-
126
-
127
-
128
-
129
-
130
-
131
-
132
-
133
-
134
-
135
-
136
-
137
-
138
-
139
-
140
-
141
-
142
-
143
-
144
-
145
-
146
-
147
-
148
-
149
-
150
-
151
-
152
-
153
-
154
 |
 |

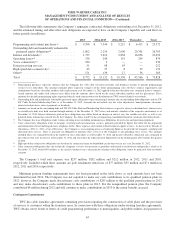
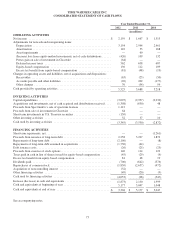
TIME WARNER CABLE INC.
CONSOLIDATED STATEMENT OF CASH FLOWS
Year Ended December 31,
2012 2011 2010
(in millions)
OPERATING ACTIVITIES
Net income ........................................................$ 2,159 $ 1,667 $ 1,313
Adjustments for noncash and nonoperating items:
Depreciation ..................................................... 3,154 2,994 2,961
Amortization ..................................................... 110 33 168
Asset impairments ................................................. — 60 —
(Income) loss from equity-method investments, net of cash distributions ...... (426) 109 132
Pretax gain on sale of investment in Clearwire .......................... (64) — —
Deferred income taxes ............................................. 562 638 687
Equity-based compensation ......................................... 130 112 109
Excess tax benefit from equity-based compensation ...................... (81) (48) (19)
Changes in operating assets and liabilities, net of acquisitions and dispositions:
Receivables ...................................................... (63) (25) (50)
Accounts payable and other liabilities ................................. (26) 202 (177)
Other changes .................................................... 70 (54) 94
Cash provided by operating activities .................................... 5,525 5,688 5,218
INVESTING ACTIVITIES
Capital expenditures ................................................. (3,095) (2,937) (2,930)
Acquisitions and investments, net of cash acquired and distributions received .... (1,308) (630) 48
Proceeds from SpectrumCo’s sale of spectrum licenses ..................... 1,112 — —
Proceeds from sale of investment in Clearwire ............................ 64 — —
Short-term investments in U.S. Treasury securities ......................... (150) — —
Other investing activities ............................................. 32 37 10
Cash used by investing activities ....................................... (3,345) (3,530) (2,872)
FINANCING ACTIVITIES
Short-term repayments, net ............................................ — — (1,261)
Proceeds from issuance of long-term debt ................................ 2,258 3,227 1,872
Repayments of long-term debt ......................................... (2,100) — (8)
Repayments of long-term debt assumed in acquisitions ...................... (1,730) (44) —
Debt issuance costs .................................................. (26) (25) (25)
Proceeds from exercise of stock options .................................. 140 114 122
Taxes paid in cash in lieu of shares issued for equity-based compensation ....... (45) (29) (9)
Excess tax benefit from equity-based compensation ........................ 81 48 19
Dividends paid ..................................................... (700) (642) (576)
Repurchases of common stock ......................................... (1,850) (2,657) (472)
Acquisition of noncontrolling interest ................................... (32) — —
Other financing activities ............................................. (49) (20) (9)
Cash used by financing activities ....................................... (4,053) (28) (347)
Increase (decrease) in cash and equivalents ............................... (1,873) 2,130 1,999
Cash and equivalents at beginning of year ................................ 5,177 3,047 1,048
Cash and equivalents at end of year .....................................$ 3,304 $ 5,177 $ 3,047
See accompanying notes.
73