Time Warner Cable 2012 Annual Report Download - page 70
Download and view the complete annual report
Please find page 70 of the 2012 Time Warner Cable annual report below. You can navigate through the pages in the report by either clicking on the pages listed below, or by using the keyword search tool below to find specific information within the annual report.-
 1
1 -
2
-
3
-
4
-
5
-
6
-
7
-
8
-
9
-
10
-
11
-
12
-
13
-
14
-
15
-
16
-
17
-
18
-
19
-
20
-
21
-
22
-
23
-
24
-
25
-
26
-
27
-
28
-
29
-
30
-
31
-
32
-
33
-
34
-
35
-
36
-
37
-
38
-
39
-
40
-
41
-
42
-
43
-
44
-
45
-
46
-
47
-
48
-
49
-
50
-
51
-
52
-
53
-
54
-
55
-
56
-
57
-
58
-
59
-
 60
60 -
 61
61 -
 62
62 -
 63
63 -
 64
64 -
 65
65 -
 66
66 -
 67
67 -
 68
68 -
 69
69 -
 70
70 -
 71
71 -
 72
72 -
 73
73 -
 74
74 -
 75
75 -
 76
76 -
 77
77 -
 78
78 -
 79
79 -
 80
80 -
81
-
82
-
83
-
84
-
85
-
86
-
87
-
88
-
89
-
90
-
91
-
92
-
93
-
94
-
95
-
96
-
97
-
98
-
99
-
100
-
101
-
102
-
103
-
104
-
105
-
106
-
107
-
108
-
109
-
110
-
111
-
112
-
113
-
114
-
115
-
116
-
117
-
118
-
119
-
120
-
121
-
122
-
123
-
124
-
125
-
126
-
127
-
128
-
129
-
130
-
131
-
132
-
133
-
134
-
135
-
136
-
137
-
138
-
139
-
140
-
141
-
142
-
143
-
144
-
145
-
146
-
147
-
148
-
149
-
150
-
151
-
152
-
153
-
154
 |
 |

TIME WARNER CABLE INC.
MANAGEMENT’S DISCUSSION AND ANALYSIS OF RESULTS
OF OPERATIONS AND FINANCIAL CONDITION—(Continued)
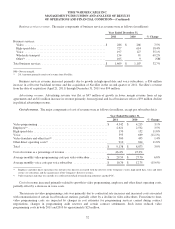
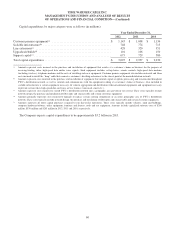
Capital expenditures by major category were as follows (in millions):
Year Ended December 31,
2012 2011 2010
Customer premise equipment(a) ........................................$ 1,143 $ 1,008 $ 1,136
Scalable infrastructure(b) .............................................. 748 774 713
Line extensions(c) ................................................... 428 320 351
Upgrades/rebuilds(d) ................................................. 101 106 150
Support capital(e) .................................................... 675 729 580
Total capital expenditures .............................................$ 3,095 $ 2,937 $ 2,930
(a) Amounts represent costs incurred in the purchase and installation of equipment that resides at a customer’s home or business for the purpose of
receiving/sending video, high-speed data and/or voice signals. Such equipment includes set-top boxes, remote controls, high-speed data modems
(including wireless), telephone modems and the costs of installing such new equipment. Customer premise equipment also includes materials and labor
costs incurred to install the “drop” cable that connects a customer’s dwelling or business to the closest point of the main distribution network.
(b) Amounts represent costs incurred in the purchase and installation of equipment that controls signal reception, processing and transmission throughout
TWC’s distribution network, as well as controls and communicates with the equipment residing at a customer’s home or business. Also included in
scalable infrastructure is certain equipment necessary for content aggregation and distribution (video-on-demand equipment) and equipment necessary
to provide certain video, high-speed data and voice service features (voicemail, email, etc.).
(c) Amounts represent costs incurred to extend TWC’s distribution network into a geographic area previously not served. These costs typically include
network design, the purchase and installation of fiber optic and coaxial cable and certain electronic equipment.
(d) Amounts primarily represent costs incurred to upgrade or replace certain existing components or an entire geographic area of TWC’s distribution
network. These costs typically include network design, the purchase and installation of fiber optic and coaxial cable and certain electronic equipment.
(e) Amounts represent all other capital purchases required to run day-to-day operations. These costs typically include vehicles, land and buildings,
computer hardware/software, office equipment, furniture and fixtures, tools and test equipment. Amounts include capitalized software costs of $296
million, $339 million and $203 million in 2012, 2011 and 2010, respectively.
The Company expects capital expenditures to be approximately $3.2 billion in 2013.
60