Time Warner Cable 2012 Annual Report Download - page 141
Download and view the complete annual report
Please find page 141 of the 2012 Time Warner Cable annual report below. You can navigate through the pages in the report by either clicking on the pages listed below, or by using the keyword search tool below to find specific information within the annual report.-
 1
1 -
2
-
3
-
4
-
5
-
6
-
7
-
8
-
9
-
10
-
11
-
12
-
13
-
14
-
15
-
16
-
17
-
18
-
19
-
20
-
21
-
22
-
23
-
24
-
25
-
26
-
27
-
28
-
29
-
30
-
31
-
32
-
33
-
34
-
35
-
36
-
37
-
38
-
39
-
40
-
41
-
42
-
43
-
44
-
45
-
46
-
47
-
48
-
49
-
50
-
51
-
52
-
53
-
54
-
55
-
56
-
57
-
58
-
59
-
60
-
61
-
62
-
63
-
64
-
65
-
66
-
67
-
68
-
69
-
70
-
71
-
72
-
73
-
74
-
75
-
76
-
77
-
78
-
79
-
80
-
81
-
82
-
83
-
84
-
85
-
86
-
87
-
88
-
89
-
90
-
91
-
92
-
93
-
94
-
95
-
96
-
97
-
98
-
99
-
100
-
101
-
102
-
103
-
104
-
105
-
106
-
107
-
108
-
109
-
110
-
111
-
112
-
113
-
114
-
115
-
116
-
117
-
118
-
119
-
120
-
121
-
122
-
123
-
124
-
125
-
126
-
127
-
128
-
129
-
130
-
 131
131 -
 132
132 -
 133
133 -
 134
134 -
 135
135 -
 136
136 -
 137
137 -
 138
138 -
 139
139 -
 140
140 -
 141
141 -
 142
142 -
 143
143 -
 144
144 -
 145
145 -
 146
146 -
 147
147 -
 148
148 -
 149
149 -
 150
150 -
 151
151 -
152
-
153
-
154
 |
 |

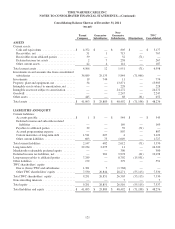
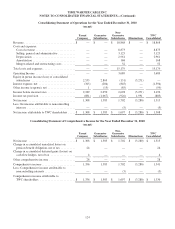
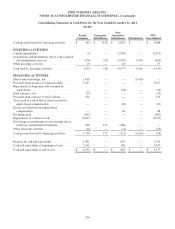
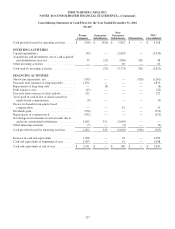
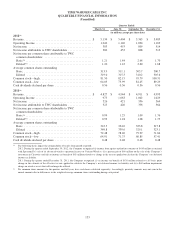
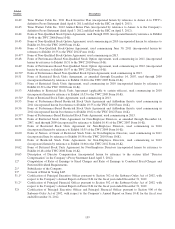
TIME WARNER CABLE INC.
SELECTED FINANCIAL INFORMATION
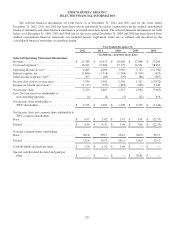
The selected financial information set forth below as of December 31, 2012 and 2011 and for the years ended
December 31, 2012, 2011 and 2010 has been derived from and should be read in conjunction with the audited consolidated
financial statements and other financial information presented elsewhere herein. The selected financial information set forth
below as of December 31, 2010, 2009 and 2008 and for the years ended December 31, 2009 and 2008 has been derived from
audited consolidated financial statements not included herein. Capitalized terms are as defined and described in the
consolidated financial statements or elsewhere herein.
Year Ended December 31,
2012 2011 2010 2009 2008
(in millions, except per share data)
Selected Operating Statement Information:
Revenue ...................................$ 21,386 $ 19,675 $ 18,868 $ 17,868 $ 17,200
Costs and expenses(a) ........................ 16,941 15,606 15,179 14,551 28,982
Operating Income (Loss)(a) .................... 4,445 4,069 3,689 3,317 (11,782)
Interest expense, net ......................... (1,606) (1,518) (1,394) (1,319) (923)
Other income (expense), net(b) ................. 497 (89) (99) (86) (367)
Income (loss) before income taxes .............. 3,336 2,462 2,196 1,912 (13,072)
Income tax benefit (provision)(c) ................ (1,177) (795) (883) (820) 5,109
Net income (loss) ........................... 2,159 1,667 1,313 1,092 (7,963)
Less: Net (income) loss attributable to
noncontrolling interests ..................... (4) (2) (5) (22) 619
Net income (loss) attributable to
TWC shareholders ........................$ 2,155 $ 1,665 $ 1,308 $ 1,070 $ (7,344)
Net income (loss) per common share attributable to
TWC common shareholders:
Basic .....................................$ 6.97 $ 5.02 $ 3.67 $ 3.07 $ (22.55)
Diluted ...................................$ 6.90 $ 4.97 $ 3.64 $ 3.05 $ (22.55)
Average common shares outstanding:
Basic ..................................... 307.8 329.7 354.2 349.0 325.7
Diluted ................................... 312.4 335.3 359.5 350.9 325.7
Cash dividends declared per share ..............$ 2.24 $ 1.92 $ 1.60 $ — $ —
Special cash dividend declared and paid per
share ...................................$ — $ — $ — $ 30.81 $ —
131