Time Warner Cable 2012 Annual Report Download - page 143
Download and view the complete annual report
Please find page 143 of the 2012 Time Warner Cable annual report below. You can navigate through the pages in the report by either clicking on the pages listed below, or by using the keyword search tool below to find specific information within the annual report.-
 1
1 -
2
-
3
-
4
-
5
-
6
-
7
-
8
-
9
-
10
-
11
-
12
-
13
-
14
-
15
-
16
-
17
-
18
-
19
-
20
-
21
-
22
-
23
-
24
-
25
-
26
-
27
-
28
-
29
-
30
-
31
-
32
-
33
-
34
-
35
-
36
-
37
-
38
-
39
-
40
-
41
-
42
-
43
-
44
-
45
-
46
-
47
-
48
-
49
-
50
-
51
-
52
-
53
-
54
-
55
-
56
-
57
-
58
-
59
-
60
-
61
-
62
-
63
-
64
-
65
-
66
-
67
-
68
-
69
-
70
-
71
-
72
-
73
-
74
-
75
-
76
-
77
-
78
-
79
-
80
-
81
-
82
-
83
-
84
-
85
-
86
-
87
-
88
-
89
-
90
-
91
-
92
-
93
-
94
-
95
-
96
-
97
-
98
-
99
-
100
-
101
-
102
-
103
-
104
-
105
-
106
-
107
-
108
-
109
-
110
-
111
-
112
-
113
-
114
-
115
-
116
-
117
-
118
-
119
-
120
-
121
-
122
-
123
-
124
-
125
-
126
-
127
-
128
-
129
-
130
-
131
-
132
-
 133
133 -
 134
134 -
 135
135 -
 136
136 -
 137
137 -
 138
138 -
 139
139 -
 140
140 -
 141
141 -
 142
142 -
 143
143 -
 144
144 -
 145
145 -
 146
146 -
 147
147 -
 148
148 -
 149
149 -
 150
150 -
 151
151 -
 152
152 -
 153
153 -
154
 |
 |

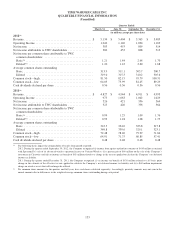
TIME WARNER CABLE INC.
QUARTERLY FINANCIAL INFORMATION
(Unaudited)
Quarter Ended
March 31, June 30, September 30, December 31,
(in millions, except per share data)
2012(a)
Revenue ...............................................$ 5,134 $ 5,404 $ 5,363 $ 5,485
Operating Income ....................................... 1,042 1,140 1,094 1,169
Net income ............................................ 383 453 809 514
Net income attributable to TWC shareholders ................. 382 452 808 513
Net income per common share attributable to TWC
common shareholders: .................................
Basic(b) .............................................. 1.21 1.44 2.64 1.70
Diluted(b) ............................................ 1.20 1.43 2.60 1.68
Average common shares outstanding
Basic ............................................... 313.9 311.1 305.7 300.7
Diluted ............................................. 319.0 315.3 310.2 305.6
Common stock—high .................................... 81.50 82.15 95.79 100.31
Common stock—low .................................... 64.03 73.99 81.45 89.29
Cash dividends declared per share .......................... 0.56 0.56 0.56 0.56
2011(a)
Revenue ...............................................$ 4,827 $ 4,944 $ 4,911 $ 4,993
Operating Income ....................................... 975 1,063 1,002 1,029
Net income ............................................ 326 421 356 564
Net income attributable to TWC shareholders ................. 325 420 356 564
Net income per common share attributable to TWC
common shareholders: .................................
Basic(b) .............................................. 0.94 1.25 1.09 1.76
Diluted(b) ............................................ 0.93 1.24 1.08 1.75
Average common shares outstanding
Basic ............................................... 343.5 334.0 323.8 317.8
Diluted ............................................. 349.8 339.6 329.1 323.1
Common stock—high .................................... 72.48 78.46 79.99 71.84
Common stock—low .................................... 64.91 71.75 60.85 57.41
Cash dividends declared per share .......................... 0.48 0.48 0.48 0.48
(a) The following items impact the comparability of results from period to period:
2012: During the quarter ended September 30, 2012, the Company recognized (i) income from equity-method investments of $430 million associated
with SpectrumCo’s sale of its advanced wireless spectrum licenses to Verizon Wireless, (ii) a pretax gain of $64 million on the sale of the Company’s
investment in Clearwire and (iii) an income tax benefit of $63 million related to a change in the tax rate applied to calculate the Company’s net deferred
income tax liability.
2011: During the quarter ended December 31, 2011, the Company recognized (i) an income tax benefit of $178 million related to a 65 basis point
change in the estimate of the effective tax rate applied to calculate the Company’s net deferred income tax liability and (ii) a $60 million impairment
charge on wireless assets that will no longer be utilized.
(b) Per common share amounts for the quarters and full years have each been calculated separately. Accordingly, quarterly amounts may not sum to the
annual amounts due to differences in the weighted-average common shares outstanding during each period.
133