Time Warner Cable 2012 Annual Report Download - page 111
Download and view the complete annual report
Please find page 111 of the 2012 Time Warner Cable annual report below. You can navigate through the pages in the report by either clicking on the pages listed below, or by using the keyword search tool below to find specific information within the annual report.-
 1
1 -
2
-
3
-
4
-
5
-
6
-
7
-
8
-
9
-
10
-
11
-
12
-
13
-
14
-
15
-
16
-
17
-
18
-
19
-
20
-
21
-
22
-
23
-
24
-
25
-
26
-
27
-
28
-
29
-
30
-
31
-
32
-
33
-
34
-
35
-
36
-
37
-
38
-
39
-
40
-
41
-
42
-
43
-
44
-
45
-
46
-
47
-
48
-
49
-
50
-
51
-
52
-
53
-
54
-
55
-
56
-
57
-
58
-
59
-
60
-
61
-
62
-
63
-
64
-
65
-
66
-
67
-
68
-
69
-
70
-
71
-
72
-
73
-
74
-
75
-
76
-
77
-
78
-
79
-
80
-
81
-
82
-
83
-
84
-
85
-
86
-
87
-
88
-
89
-
90
-
91
-
92
-
93
-
94
-
95
-
96
-
97
-
98
-
99
-
100
-
 101
101 -
 102
102 -
 103
103 -
 104
104 -
 105
105 -
 106
106 -
 107
107 -
 108
108 -
 109
109 -
 110
110 -
 111
111 -
 112
112 -
 113
113 -
 114
114 -
 115
115 -
 116
116 -
 117
117 -
 118
118 -
 119
119 -
 120
120 -
 121
121 -
122
-
123
-
124
-
125
-
126
-
127
-
128
-
129
-
130
-
131
-
132
-
133
-
134
-
135
-
136
-
137
-
138
-
139
-
140
-
141
-
142
-
143
-
144
-
145
-
146
-
147
-
148
-
149
-
150
-
151
-
152
-
153
-
154
 |
 |

TIME WARNER CABLE INC.
NOTES TO CONSOLIDATED FINANCIAL STATEMENTS—(Continued)
For the year ended December 31, 2012, TWC granted 1.442 million RSUs at a weighted-average grant date fair value of
$77.09 per RSU, including 196,000 PBUs at a weighted-average grant date fair value of $77.13 per PBU. For the year ended
December 31, 2011, TWC granted 1.477 million RSUs at a weighted-average grant date fair value of $72.09 per RSU,
including 158,000 PBUs at a weighted-average grant date fair value of $72.05 per PBU. For the year ended December 31,
2010, TWC granted 1.941 million RSUs at a weighted-average grant date fair value of $45.19 per RSU. No PBUs were
granted in 2010.
As of December 31, 2012, the aggregate intrinsic value of unvested RSUs was $490 million. Total unrecognized
compensation cost related to unvested RSUs as of December 31, 2012, without taking into account expected forfeitures, is
$137 million and is expected to be recognized over a weighted-average period of 2.51 years. The fair value of RSUs that
vested during the year was $95 million in 2012, $103 million in 2011 and $49 million in 2010.
During February 2013, TWC granted approximately 1.2 million RSUs under the 2011 Plan, of which 133,000 were
PBUs.
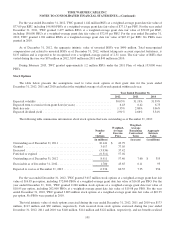
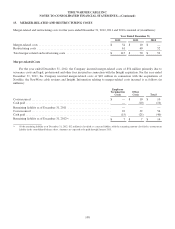
Stock Options
The table below presents the assumptions used to value stock options at their grant date for the years ended
December 31, 2012, 2011 and 2010 and reflects the weighted average of all awards granted within each year:
Year Ended December 31,
2012 2011 2010
Expected volatility .................................................. 30.03% 31.19% 31.39%
Expected term to exercise from grant date (in years) ........................ 6.43 6.42 6.73
Risk-free rate ....................................................... 1.35% 2.80% 3.06%
Expected dividend yield .............................................. 2.91% 2.66% 3.54%
The following table summarizes information about stock options that were outstanding as of December 31, 2012:
Number
of
Options
Weighted-
Average
Exercise
Price
Weighted-
Average
Remaining
Contractual
Term
Aggregate
Intrinsic
Value
(in millions) (in years) (in millions)
Outstanding as of December 31, 2011 ....................... 10.141 $ 43.79
Granted ............................................... 3.017 77.05
Exercised .............................................. (3.936) 37.42
Forfeited or expired ..................................... (0.311) 57.02
Outstanding as of December 31, 2012 ....................... 8.911 57.40 7.60 $ 355
Exercisable as of December 31, 2012 ........................ 1.780 43.65 6.11 95
Expected to vest as of December 31, 2012 .................... 6.934 60.55 7.95 254
For the year ended December 31, 2012, TWC granted 3.017 million stock options at a weighted-average grant date fair
value of $16.85 per option, including 372,000 PBOs at a weighted-average grant date fair value of $16.85 per PBO. For the
year ended December 31, 2011, TWC granted 2.240 million stock options at a weighted-average grant date fair value of
$18.95 per option, including 262,000 PBOs at a weighted-average grant date fair value of $19.08 per PBO. For the year
ended December 31, 2010, TWC granted 3.803 million stock options at a weighted-average grant date fair value of $10.95
per option. No PBOs were granted in 2010.
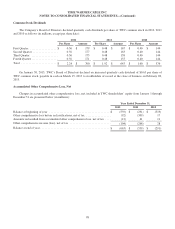
The total intrinsic value of stock options exercised during the year ended December 31, 2012, 2011 and 2010 was $173
million, $113 million and $69 million, respectively. Cash received from stock options exercised during the year ended
December 31, 2012, 2011 and 2010 was $140 million, $114 million and $122 million, respectively, and tax benefits realized
101