Time Warner Cable 2012 Annual Report Download - page 81
Download and view the complete annual report
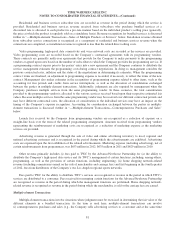
Please find page 81 of the 2012 Time Warner Cable annual report below. You can navigate through the pages in the report by either clicking on the pages listed below, or by using the keyword search tool below to find specific information within the annual report.-
 1
1 -
2
-
3
-
4
-
5
-
6
-
7
-
8
-
9
-
10
-
11
-
12
-
13
-
14
-
15
-
16
-
17
-
18
-
19
-
20
-
21
-
22
-
23
-
24
-
25
-
26
-
27
-
28
-
29
-
30
-
31
-
32
-
33
-
34
-
35
-
36
-
37
-
38
-
39
-
40
-
41
-
42
-
43
-
44
-
45
-
46
-
47
-
48
-
49
-
50
-
51
-
52
-
53
-
54
-
55
-
56
-
57
-
58
-
59
-
60
-
61
-
62
-
63
-
64
-
65
-
66
-
67
-
68
-
69
-
70
-
 71
71 -
 72
72 -
 73
73 -
 74
74 -
 75
75 -
 76
76 -
 77
77 -
 78
78 -
 79
79 -
 80
80 -
 81
81 -
 82
82 -
 83
83 -
 84
84 -
 85
85 -
 86
86 -
 87
87 -
 88
88 -
 89
89 -
 90
90 -
 91
91 -
92
-
93
-
94
-
95
-
96
-
97
-
98
-
99
-
100
-
101
-
102
-
103
-
104
-
105
-
106
-
107
-
108
-
109
-
110
-
111
-
112
-
113
-
114
-
115
-
116
-
117
-
118
-
119
-
120
-
121
-
122
-
123
-
124
-
125
-
126
-
127
-
128
-
129
-
130
-
131
-
132
-
133
-
134
-
135
-
136
-
137
-
138
-
139
-
140
-
141
-
142
-
143
-
144
-
145
-
146
-
147
-
148
-
149
-
150
-
151
-
152
-
153
-
154
 |
 |

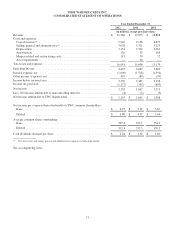
TIME WARNER CABLE INC.
CONSOLIDATED STATEMENT OF OPERATIONS
Year Ended December 31,
2012 2011 2010
(in millions, except per share data)
Revenue ...........................................................$ 21,386 $ 19,675 $ 18,868
Costs and expenses:
Cost of revenue(a) ................................................. 9,942 9,138 8,873
Selling, general and administrative(a) .................................. 3,620 3,311 3,125
Depreciation ..................................................... 3,154 2,994 2,961
Amortization ..................................................... 110 33 168
Merger-related and restructuring costs ................................. 115 70 52
Asset impairments ................................................. — 60 —
Total costs and expenses .............................................. 16,941 15,606 15,179
Operating Income ................................................... 4,445 4,069 3,689
Interest expense, net ................................................. (1,606) (1,518) (1,394)
Other income (expense), net ........................................... 497 (89) (99)
Income before income taxes ........................................... 3,336 2,462 2,196
Income tax provision ................................................ (1,177) (795) (883)
Net income ........................................................ 2,159 1,667 1,313
Less: Net income attributable to noncontrolling interests .................... (4) (2) (5)
Net income attributable to TWC shareholders .............................$ 2,155 $ 1,665 $ 1,308
Net income per common share attributable to TWC common shareholders:
Basic ...........................................................$ 6.97 $ 5.02 $ 3.67
Diluted .........................................................$ 6.90 $ 4.97 $ 3.64
Average common shares outstanding:
Basic ........................................................... 307.8 329.7 354.2
Diluted ......................................................... 312.4 335.3 359.5
Cash dividends declared per share ......................................$ 2.24 $ 1.92 $ 1.60
(a) Cost of revenue and selling, general and administrative expenses exclude depreciation.
See accompanying notes.
71