Time Warner Cable 2012 Annual Report Download - page 142
Download and view the complete annual report
Please find page 142 of the 2012 Time Warner Cable annual report below. You can navigate through the pages in the report by either clicking on the pages listed below, or by using the keyword search tool below to find specific information within the annual report.-
 1
1 -
2
-
3
-
4
-
5
-
6
-
7
-
8
-
9
-
10
-
11
-
12
-
13
-
14
-
15
-
16
-
17
-
18
-
19
-
20
-
21
-
22
-
23
-
24
-
25
-
26
-
27
-
28
-
29
-
30
-
31
-
32
-
33
-
34
-
35
-
36
-
37
-
38
-
39
-
40
-
41
-
42
-
43
-
44
-
45
-
46
-
47
-
48
-
49
-
50
-
51
-
52
-
53
-
54
-
55
-
56
-
57
-
58
-
59
-
60
-
61
-
62
-
63
-
64
-
65
-
66
-
67
-
68
-
69
-
70
-
71
-
72
-
73
-
74
-
75
-
76
-
77
-
78
-
79
-
80
-
81
-
82
-
83
-
84
-
85
-
86
-
87
-
88
-
89
-
90
-
91
-
92
-
93
-
94
-
95
-
96
-
97
-
98
-
99
-
100
-
101
-
102
-
103
-
104
-
105
-
106
-
107
-
108
-
109
-
110
-
111
-
112
-
113
-
114
-
115
-
116
-
117
-
118
-
119
-
120
-
121
-
122
-
123
-
124
-
125
-
126
-
127
-
128
-
129
-
130
-
131
-
 132
132 -
 133
133 -
 134
134 -
 135
135 -
 136
136 -
 137
137 -
 138
138 -
 139
139 -
 140
140 -
 141
141 -
 142
142 -
 143
143 -
 144
144 -
 145
145 -
 146
146 -
 147
147 -
 148
148 -
 149
149 -
 150
150 -
 151
151 -
 152
152 -
153
-
154
 |
 |

TIME WARNER CABLE INC.
SELECTED FINANCIAL INFORMATION—(Continued)
December 31,
2012 2011 2010 2009 2008
(in millions)
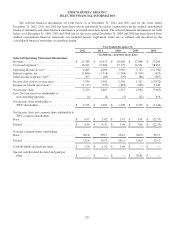
Selected Balance Sheet Information:
Cash and equivalents ........................$ 3,304 $ 5,177 $ 3,047 $ 1,048 $ 5,449
Total assets ................................ 49,809 48,276 45,822 43,694 47,889
Total debt(d) ................................ 26,689 26,442 23,121 22,331 17,728
Mandatorily redeemable preferred equity(e) ....... 300 300 300 300 300
(a) Total costs and expenses and Operating Income (Loss) include merger-related and restructuring costs of $115 million in 2012, $70 million in 2011,
$52 million in 2010, $81 million in 2009 and $15 million in 2008. Total costs and expenses and Operating Income (Loss) in 2011 includes a $60
million impairment charge on wireless assets that will no longer be utilized. Total costs and expenses and Operating Income (Loss) in 2008 includes a
$14.822 billion impairment charge on cable franchise rights and a $58 million loss on the sale of cable systems.
(b) Other income (expense), net, includes income (losses) from equity-method investments of $454 million in 2012, $(88) million in 2011, $(110) million
in 2010, $(49) million in 2009 and $16 million in 2008. Income from equity-method investments in 2012 primarily consists of a pretax gain of
$430 million associated with SpectrumCo’s sale of its advanced wireless spectrum licenses to Verizon Wireless. Other income (expense), net, in 2012
includes a $64 million gain on the sale of the Company’s investment in Clearwire. Other income (expense), net, in 2008 includes a $367 million
impairment charge on the Company’s equity-method investment in Clearwire Communications.
(c) On September 30, 2012, the Company completed an internal reorganization to simplify its organizational structure, which resulted in the Company
recording an income tax benefit of $63 million during the third quarter of 2012 related to a change in the tax rate applied to calculate the Company’s
net deferred income tax liability. During the fourth quarter of 2011, TWC completed its income tax returns for the 2010 taxable year, its first full-year
income tax returns subsequent to the Separation, reflecting the income tax positions and state income tax apportionments of TWC as a standalone
taxpayer. Based on these returns, the Company concluded that an approximate 65 basis point change in the estimate of the effective tax rate applied to
calculate its net deferred income tax liability was required. As a result, TWC recorded a noncash income tax benefit of $178 million during the fourth
quarter of 2011.
(d) Amounts include $1.518 billion, $2.122 billion and $1 million of debt due within one year as of December 31, 2012, 2011 and 2008, respectively.
(e) As of December 31, 2012, mandatorily redeemable preferred equity, which matures on August 1, 2013, is classified as a current liability in the
accompanying consolidated balance sheet.
132