Time Warner Cable 2012 Annual Report Download - page 71
Download and view the complete annual report
Please find page 71 of the 2012 Time Warner Cable annual report below. You can navigate through the pages in the report by either clicking on the pages listed below, or by using the keyword search tool below to find specific information within the annual report.-
 1
1 -
2
-
3
-
4
-
5
-
6
-
7
-
8
-
9
-
10
-
11
-
12
-
13
-
14
-
15
-
16
-
17
-
18
-
19
-
20
-
21
-
22
-
23
-
24
-
25
-
26
-
27
-
28
-
29
-
30
-
31
-
32
-
33
-
34
-
35
-
36
-
37
-
38
-
39
-
40
-
41
-
42
-
43
-
44
-
45
-
46
-
47
-
48
-
49
-
50
-
51
-
52
-
53
-
54
-
55
-
56
-
57
-
58
-
59
-
60
-
 61
61 -
 62
62 -
 63
63 -
 64
64 -
 65
65 -
 66
66 -
 67
67 -
 68
68 -
 69
69 -
 70
70 -
 71
71 -
 72
72 -
 73
73 -
 74
74 -
 75
75 -
 76
76 -
 77
77 -
 78
78 -
 79
79 -
 80
80 -
 81
81 -
82
-
83
-
84
-
85
-
86
-
87
-
88
-
89
-
90
-
91
-
92
-
93
-
94
-
95
-
96
-
97
-
98
-
99
-
100
-
101
-
102
-
103
-
104
-
105
-
106
-
107
-
108
-
109
-
110
-
111
-
112
-
113
-
114
-
115
-
116
-
117
-
118
-
119
-
120
-
121
-
122
-
123
-
124
-
125
-
126
-
127
-
128
-
129
-
130
-
131
-
132
-
133
-
134
-
135
-
136
-
137
-
138
-
139
-
140
-
141
-
142
-
143
-
144
-
145
-
146
-
147
-
148
-
149
-
150
-
151
-
152
-
153
-
154
 |
 |

TIME WARNER CABLE INC.
MANAGEMENT’S DISCUSSION AND ANALYSIS OF RESULTS
OF OPERATIONS AND FINANCIAL CONDITION—(Continued)
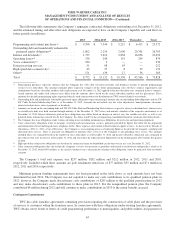
Financing Activities
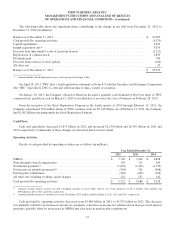
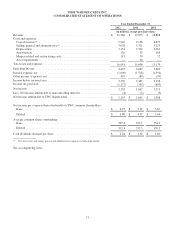
Details of cash used by financing activities are as follows (in millions):
Year Ended December 31,
2012 2011 2010
Short-term repayments, net(a) ..........................................$ — $ — $ (1,261)
Proceeds from issuance of long-term debt ................................ 2,258 3,227 1,872
Repayments of long-term debt ......................................... (2,100) — (8)
Repayments of long-term debt assumed in acquisitions ...................... (1,730) (44) —
Debt issuance costs .................................................. (26) (25) (25)
Proceeds from exercise of stock options .................................. 140 114 122
Taxes paid in cash in lieu of shares issued for equity-based compensation ....... (45) (29) (9)
Excess tax benefit from equity-based compensation ........................ 81 48 19
Dividends paid ..................................................... (700) (642) (576)
Repurchases of common stock ......................................... (1,850) (2,657) (472)
Acquisition of noncontrolling interest(b) .................................. (32) — —
Other financing activities ............................................. (49) (20) (9)
Cash used by financing activities .......................................$ (4,053) $ (28) $ (347)
(a) Short-term repayments, net, reflects repayments under the Company’s commercial paper program with maturities of three months or less, net of
borrowings.
(b) During the fourth quarter of 2012, TWC acquired the remaining 45.81% noncontrolling interest in Erie for $32 million and, as a result, TWC owns
100% of Erie.
Cash used by financing activities was $4.053 billion in 2012 compared to $28 million in 2011. Cash used by financing
activities in 2012 primarily consisted of the repayments of TWE’s 10.150% senior notes due May 2012 ($250 million in
aggregate principal amount), TWC’s 5.400% senior notes due July 2012 ($1.5 billion in aggregate principal amount) and
TWCE’s 8.875% senior notes due October 2012 ($350 million in aggregate principal amount), the repayment of Insight’s
senior credit facility and senior notes, repurchases of TWC common stock and the payment of quarterly cash dividends,
partially offset by the net proceeds of the 2012 Bond Offerings and the net proceeds from the exercise of stock options. Cash
used by financing activities in 2011 primarily consisted of repurchases of TWC common stock and the payment of quarterly
cash dividends, partially offset by the net proceeds of the 2011 Bond Offerings and the net proceeds from the exercise of
stock options.
Cash used by financing activities was $28 million in 2011 compared to $347 million in 2010. Cash used by financing
activities in 2011 primarily consisted of repurchases of TWC common stock and the payment of quarterly cash dividends,
partially offset by the net proceeds of the 2011 Bond Offerings and the net proceeds from the exercise of stock options. Cash
used by financing activities in 2010 primarily included net repayments under the Company’s commercial paper program, the
payment of quarterly cash dividends and repurchases of TWC common stock, partially offset by the net proceeds of the
public debt issuance in November 2010 and the net proceeds from the exercise of stock options.
61