Time Warner Cable 2012 Annual Report Download - page 55
Download and view the complete annual report
Please find page 55 of the 2012 Time Warner Cable annual report below. You can navigate through the pages in the report by either clicking on the pages listed below, or by using the keyword search tool below to find specific information within the annual report.-
 1
1 -
2
-
3
-
4
-
5
-
6
-
7
-
8
-
9
-
10
-
11
-
12
-
13
-
14
-
15
-
16
-
17
-
18
-
19
-
20
-
21
-
22
-
23
-
24
-
25
-
26
-
27
-
28
-
29
-
30
-
31
-
32
-
33
-
34
-
35
-
36
-
37
-
38
-
39
-
40
-
41
-
42
-
43
-
44
-
 45
45 -
 46
46 -
 47
47 -
 48
48 -
 49
49 -
 50
50 -
 51
51 -
 52
52 -
 53
53 -
 54
54 -
 55
55 -
 56
56 -
 57
57 -
 58
58 -
 59
59 -
 60
60 -
 61
61 -
 62
62 -
 63
63 -
 64
64 -
 65
65 -
66
-
67
-
68
-
69
-
70
-
71
-
72
-
73
-
74
-
75
-
76
-
77
-
78
-
79
-
80
-
81
-
82
-
83
-
84
-
85
-
86
-
87
-
88
-
89
-
90
-
91
-
92
-
93
-
94
-
95
-
96
-
97
-
98
-
99
-
100
-
101
-
102
-
103
-
104
-
105
-
106
-
107
-
108
-
109
-
110
-
111
-
112
-
113
-
114
-
115
-
116
-
117
-
118
-
119
-
120
-
121
-
122
-
123
-
124
-
125
-
126
-
127
-
128
-
129
-
130
-
131
-
132
-
133
-
134
-
135
-
136
-
137
-
138
-
139
-
140
-
141
-
142
-
143
-
144
-
145
-
146
-
147
-
148
-
149
-
150
-
151
-
152
-
153
-
154
 |
 |

TIME WARNER CABLE INC.
MANAGEMENT’S DISCUSSION AND ANALYSIS OF RESULTS
OF OPERATIONS AND FINANCIAL CONDITION—(Continued)
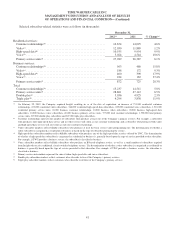
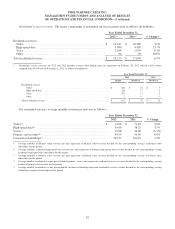
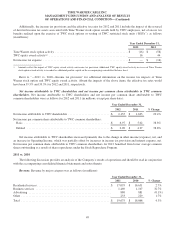
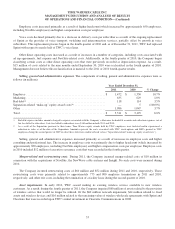
Cost of revenue. The major components of cost of revenue were as follows (in millions, except per subscriber data):
Year Ended December 31,
2012 2011 % Change
Video programming ................................................$ 4,621 $ 4,342 6.4%
Employee(a) ....................................................... 2,865 2,621 9.3%
High-speed data ................................................... 185 170 8.8%
Voice ............................................................ 614 595 3.2%
Video franchise and other fees(b) ...................................... 519 500 3.8%
Other direct operating costs(a) ......................................... 1,138 910 25.1%
Total ............................................................$ 9,942 $ 9,138 8.8%
Cost of revenue as a percentage of revenue .............................. 46.5% 46.4%
Average monthly video programming costs per video subscriber .............$ 31.12 $ 29.59 5.2%
Average monthly voice costs per voice subscriber ........................$ 10.01 $ 10.76 (7.0%)
(a) Employee and other direct operating costs include costs directly associated with the delivery of the Company’s video, high-speed data, voice and other
services to subscribers and the maintenance of the Company’s delivery systems.
(b) Video franchise and other fees include fees collected on behalf of franchising authorities and the FCC.
Cost of revenue increased primarily related to growth in video programming, employee and other direct operating costs.
The increase in video programming costs was primarily due to contractual rate increases, carriage of new networks and
the acquisition of Insight, partially offset by organic declines in video subscribers and transactional video-on-demand costs.
For 2012 and 2011, video programming costs were reduced by approximately $40 million (of which approximately
$20 million was recorded in the fourth quarter of 2012) and $25 million, respectively, due to changes in cost estimates for
programming services carried during contract negotiations, changes in programming audit reserves and certain contract
settlements. The Company expects the rate of growth in video programming costs per video subscriber in 2013 to increase
compared to 2012.
Employee costs increased primarily as a result of acquisitions, higher compensation costs per employee and increased
business services headcount, partially offset by a decline in residential services headcount. Pension costs increased
$41 million in 2012, primarily due to the decline in interest rates to historically low levels.
Voice costs, which consist of the direct costs associated with the delivery of voice services, including network
connectivity costs, increased primarily due to an increase in voice subscribers due to both organic growth and the Insight
acquisition, partially offset by a decrease in delivery costs per subscriber as a result of the ongoing replacement of Sprint
Nextel Corporation (“Sprint”) as the provider of voice transport, switching and interconnection services. The Sprint
replacement process began in the fourth quarter of 2010 and, as of December 31, 2012, TWC had replaced Sprint with
respect to nearly half of TWC’s voice lines. The Company expects to migrate the majority of the remaining voice lines in the
second half of 2013 and to complete the process during the first quarter of 2014. The Company expects average voice costs
per voice subscriber to decrease modestly in 2013 compared to 2012.
Other direct operating costs increased as a result of costs associated with Insight and the LA RSNs, as well as increases
in a number of categories, including information technology expense, costs associated with ad rep agreements, repairs and
maintenance costs and facilities expense.
45