Time Warner Cable 2012 Annual Report Download - page 67
Download and view the complete annual report
Please find page 67 of the 2012 Time Warner Cable annual report below. You can navigate through the pages in the report by either clicking on the pages listed below, or by using the keyword search tool below to find specific information within the annual report.-
 1
1 -
2
-
3
-
4
-
5
-
6
-
7
-
8
-
9
-
10
-
11
-
12
-
13
-
14
-
15
-
16
-
17
-
18
-
19
-
20
-
21
-
22
-
23
-
24
-
25
-
26
-
27
-
28
-
29
-
30
-
31
-
32
-
33
-
34
-
35
-
36
-
37
-
38
-
39
-
40
-
41
-
42
-
43
-
44
-
45
-
46
-
47
-
48
-
49
-
50
-
51
-
52
-
53
-
54
-
55
-
56
-
 57
57 -
 58
58 -
 59
59 -
 60
60 -
 61
61 -
 62
62 -
 63
63 -
 64
64 -
 65
65 -
 66
66 -
 67
67 -
 68
68 -
 69
69 -
 70
70 -
 71
71 -
 72
72 -
 73
73 -
 74
74 -
 75
75 -
 76
76 -
 77
77 -
78
-
79
-
80
-
81
-
82
-
83
-
84
-
85
-
86
-
87
-
88
-
89
-
90
-
91
-
92
-
93
-
94
-
95
-
96
-
97
-
98
-
99
-
100
-
101
-
102
-
103
-
104
-
105
-
106
-
107
-
108
-
109
-
110
-
111
-
112
-
113
-
114
-
115
-
116
-
117
-
118
-
119
-
120
-
121
-
122
-
123
-
124
-
125
-
126
-
127
-
128
-
129
-
130
-
131
-
132
-
133
-
134
-
135
-
136
-
137
-
138
-
139
-
140
-
141
-
142
-
143
-
144
-
145
-
146
-
147
-
148
-
149
-
150
-
151
-
152
-
153
-
154
 |
 |

TIME WARNER CABLE INC.
MANAGEMENT’S DISCUSSION AND ANALYSIS OF RESULTS
OF OPERATIONS AND FINANCIAL CONDITION—(Continued)
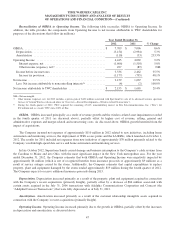
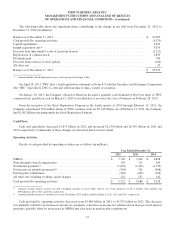
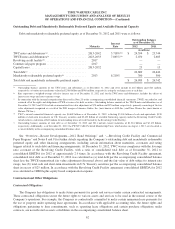
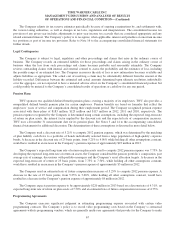
The following table shows the significant items contributing to the change in net debt from December 31, 2011 to
December 31, 2012 (in millions):
Balance as of December 31, 2011 ..............................................................$ 21,265
Cash provided by operating activities ............................................................ (5,525)
Capital expenditures ......................................................................... 3,095
Insight acquisition, net(a) ...................................................................... 3,073
Proceeds from SpectrumCo’s sale of spectrum licenses ............................................. (1,112)
Repurchases of common stock ................................................................. 1,850
Dividends paid ............................................................................. 700
Proceeds from exercise of stock options .......................................................... (140)
All other, net ............................................................................... 29
Balance as of December 31, 2012 ..............................................................$ 23,235
(a) Amount includes the Insight purchase price and repayment of Insight’s debt.
On April 28, 2011, TWC filed a shelf registration statement on Form S-3 with the Securities and Exchange Commission
(the “SEC”) that allows TWC to offer and sell from time to time a variety of securities.
On January 30, 2013, the Company’s Board of Directors declared a quarterly cash dividend of $0.65 per share of TWC
common stock, payable in cash on March 15, 2013 to stockholders of record at the close of business on February 28, 2013.
From the inception of the Stock Repurchase Program in the fourth quarter of 2010 through February 13, 2013, the
Company repurchased 70.8 million shares of TWC common stock for $5.340 billion. As of February 13, 2013, the Company
had $1.902 billion remaining under the Stock Repurchase Program.
Cash Flows
Cash and equivalents decreased $1.873 billion in 2012 and increased $2.130 billion and $1.999 billion in 2011 and
2010, respectively. Components of these changes are discussed below in more detail.
Operating Activities
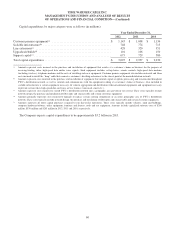
Details of cash provided by operating activities are as follows (in millions):
Year Ended December 31,
2012 2011 2010
OIBDA ...........................................................$ 7,709 $ 7,096 $ 6,818
Noncash equity-based compensation .................................... 130 112 109
Net interest payments(a) ............................................... (1,602) (1,434) (1,359)
Net income tax refunds (payments)(b) .................................... (544) 162 (388)
Pension plan contributions ............................................ (289) (405) (104)
All other, net, including working capital changes .......................... 121 157 142
Cash provided by operating activities ....................................$ 5,525 $ 5,688 $ 5,218
(a) Amounts include interest income received (including amounts received under interest rate swap contracts) of $171 million, $161 million and
$99 million in 2012, 2011 and 2010, respectively.
(b) Amounts include income tax refunds received of $10 million, $273 million and $93 million in 2012, 2011 and 2010, respectively.
Cash provided by operating activities decreased from $5.688 billion in 2011 to $5.525 billion in 2012. This decrease
was primarily related to an increase in income tax payments, a decrease in income tax refunds and an increase in net interest
payments, partially offset by an increase in OIBDA and a decrease in pension plan contributions.
57