Time Warner Cable 2012 Annual Report Download - page 64
Download and view the complete annual report
Please find page 64 of the 2012 Time Warner Cable annual report below. You can navigate through the pages in the report by either clicking on the pages listed below, or by using the keyword search tool below to find specific information within the annual report.-
 1
1 -
2
-
3
-
4
-
5
-
6
-
7
-
8
-
9
-
10
-
11
-
12
-
13
-
14
-
15
-
16
-
17
-
18
-
19
-
20
-
21
-
22
-
23
-
24
-
25
-
26
-
27
-
28
-
29
-
30
-
31
-
32
-
33
-
34
-
35
-
36
-
37
-
38
-
39
-
40
-
41
-
42
-
43
-
44
-
45
-
46
-
47
-
48
-
49
-
50
-
51
-
52
-
53
-
 54
54 -
 55
55 -
 56
56 -
 57
57 -
 58
58 -
 59
59 -
 60
60 -
 61
61 -
 62
62 -
 63
63 -
 64
64 -
 65
65 -
 66
66 -
 67
67 -
 68
68 -
 69
69 -
 70
70 -
 71
71 -
 72
72 -
 73
73 -
 74
74 -
75
-
76
-
77
-
78
-
79
-
80
-
81
-
82
-
83
-
84
-
85
-
86
-
87
-
88
-
89
-
90
-
91
-
92
-
93
-
94
-
95
-
96
-
97
-
98
-
99
-
100
-
101
-
102
-
103
-
104
-
105
-
106
-
107
-
108
-
109
-
110
-
111
-
112
-
113
-
114
-
115
-
116
-
117
-
118
-
119
-
120
-
121
-
122
-
123
-
124
-
125
-
126
-
127
-
128
-
129
-
130
-
131
-
132
-
133
-
134
-
135
-
136
-
137
-
138
-
139
-
140
-
141
-
142
-
143
-
144
-
145
-
146
-
147
-
148
-
149
-
150
-
151
-
152
-
153
-
154
 |
 |

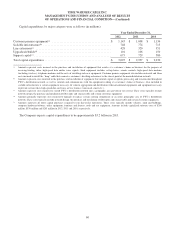
TIME WARNER CABLE INC.
MANAGEMENT’S DISCUSSION AND ANALYSIS OF RESULTS
OF OPERATIONS AND FINANCIAL CONDITION—(Continued)
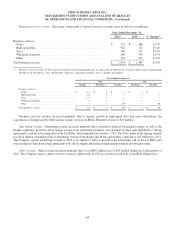
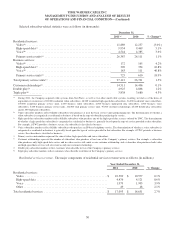
Reconciliation of OIBDA to Operating Income. The following table reconciles OIBDA to Operating Income. In
addition, the table provides the components from Operating Income to net income attributable to TWC shareholders for
purposes of the discussions that follow (in millions):
Year Ended December 31,
2011 2010 % Change
OIBDA ........................................................$ 7,096 $ 6,818 4.1%
Depreciation .................................................. (2,994) (2,961) 1.1%
Amortization ................................................. (33) (168) (80.4%)
Operating Income ............................................... 4,069 3,689 10.3%
Interest expense, net ......................................... (1,518) (1,394) 8.9%
Other income (expense), net ................................... (89) (99) (10.1%)
Income before income taxes ..................................... 2,462 2,196 12.1%
Income tax provision ......................................... (795) (883) (10.0%)
Net income ..................................................... 1,667 1,313 27.0%
Less: Net income attributable to noncontrolling interests ............... (2) (5) (60.0%)
Net income attributable to TWC shareholders .........................$ 1,665 $ 1,308 27.3%
OIBDA. OIBDA increased principally as a result of revenue growth, partially offset by higher cost of revenue and
selling, general and administrative expenses and the wireless-related asset impairments recorded in the fourth quarter of
2011, as discussed above. Included within OIBDA for 2011 are NaviSite and NewWave cable system revenue of $94 million
and $13 million, respectively, and operating expenses of $72 million and $8 million, respectively.
The results for 2011 included net expenses from new initiatives of approximately $70 million primarily related to the
Company’s mobile high-speed data service and home automation and monitoring services. The results for 2010 included net
expenses of approximately $50 million related to mobile high-speed data service.
Depreciation. As discussed above, depreciation expense for the fourth quarter of 2010 benefited from a reclassification
of approximately $15 million.
Amortization. The decrease in amortization expense was primarily due to (a) approximately $880 million of customer
relationships acquired in the Adelphia/Comcast Transactions that were fully amortized as of July 31, 2010 and
(b) approximately $70 million of customer relationships that the Company acquired as a result of the 2007 dissolution of
Texas and Kansas City Cable Partners, L.P. that were fully amortized as of December 31, 2010.
Operating Income. Operating Income increased primarily due to the increase in OIBDA and the decrease in
amortization expense, as discussed above.
Interest expense, net. Interest expense, net, increased primarily due to higher average debt outstanding during 2011 as
compared to 2010 as a result of the public debt issuances in November 2010 and the 2011 Bond Offerings, partially offset by
a $46 million increase in benefits received from interest rate swaps.
54