Time Warner Cable 2012 Annual Report Download - page 49
Download and view the complete annual report
Please find page 49 of the 2012 Time Warner Cable annual report below. You can navigate through the pages in the report by either clicking on the pages listed below, or by using the keyword search tool below to find specific information within the annual report.-
 1
1 -
2
-
3
-
4
-
5
-
6
-
7
-
8
-
9
-
10
-
11
-
12
-
13
-
14
-
15
-
16
-
17
-
18
-
19
-
20
-
21
-
22
-
23
-
24
-
25
-
26
-
27
-
28
-
29
-
30
-
31
-
32
-
33
-
34
-
35
-
36
-
37
-
38
-
 39
39 -
 40
40 -
 41
41 -
 42
42 -
 43
43 -
 44
44 -
 45
45 -
 46
46 -
 47
47 -
 48
48 -
 49
49 -
 50
50 -
 51
51 -
 52
52 -
 53
53 -
 54
54 -
 55
55 -
 56
56 -
 57
57 -
 58
58 -
 59
59 -
60
-
61
-
62
-
63
-
64
-
65
-
66
-
67
-
68
-
69
-
70
-
71
-
72
-
73
-
74
-
75
-
76
-
77
-
78
-
79
-
80
-
81
-
82
-
83
-
84
-
85
-
86
-
87
-
88
-
89
-
90
-
91
-
92
-
93
-
94
-
95
-
96
-
97
-
98
-
99
-
100
-
101
-
102
-
103
-
104
-
105
-
106
-
107
-
108
-
109
-
110
-
111
-
112
-
113
-
114
-
115
-
116
-
117
-
118
-
119
-
120
-
121
-
122
-
123
-
124
-
125
-
126
-
127
-
128
-
129
-
130
-
131
-
132
-
133
-
134
-
135
-
136
-
137
-
138
-
139
-
140
-
141
-
142
-
143
-
144
-
145
-
146
-
147
-
148
-
149
-
150
-
151
-
152
-
153
-
154
 |
 |
TIME WARNER CABLE INC.
MANAGEMENT’S DISCUSSION AND ANALYSIS OF RESULTS
OF OPERATIONS AND FINANCIAL CONDITION—(Continued)
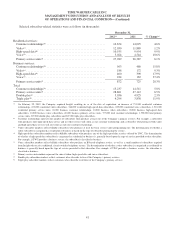
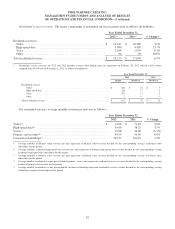
Other. Other revenue primarily includes (i) fees paid to TWC (totaling $135 million, $135 million and $131 million in
2012, 2011 and 2010, respectively) primarily by the Advance/Newhouse Partnership for (a) the ability to distribute the
Company’s high-speed data service and (b) TWC’s management of certain functions, including, among others,
programming, as well as the provision of certain functions, including engineering, (ii) home shopping network-related
revenue (including commissions earned on the sale of merchandise and carriage fees) and (iii) beginning in the fourth quarter
of 2012, fees from LA RSN distributors (“LA RSN affiliate fees”).
Costs and Expenses
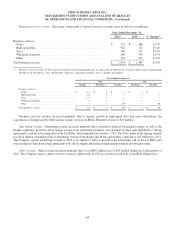
Cost of revenue includes the following costs directly associated with the delivery of services to subscribers or the
maintenance of the Company’s delivery systems: video programming costs; high-speed data connectivity costs; voice
network costs; other service-related expenses, including non-administrative labor; franchise fees; and other related costs.
Beginning in the fourth quarter of 2012, cost of revenue also includes costs directly associated with the LA RSNs, including
content acquisition costs.
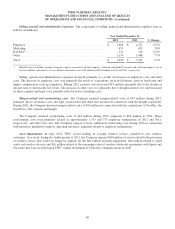
Selling, general and administrative expenses include amounts not directly associated with the delivery of services to
subscribers or the maintenance of the Company’s delivery systems, such as administrative labor costs, marketing expenses,
bad debt expense, billing system charges, non-plant repair and maintenance costs and other administrative overhead costs.
Cost of revenue and selling, general and administrative expenses exclude depreciation expense, which is presented
separately in the accompanying consolidated statement of operations.
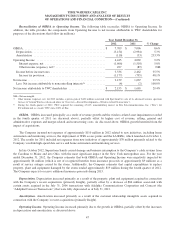
Use of Operating Income before Depreciation and Amortization
In discussing its performance, the Company may use certain measures that are not calculated and presented in
accordance with U.S. generally accepted accounting principles (“GAAP”). These measures include Operating Income before
Depreciation and Amortization (“OIBDA”), which the Company defines as Operating Income before depreciation of tangible
assets and amortization of intangible assets.
Management uses OIBDA, among other measures, in evaluating the performance of the Company’s business because it
eliminates the effects of (i) considerable amounts of noncash depreciation and amortization and (ii) items not within the
control of the Company’s operations managers (such as net income attributable to noncontrolling interests, income tax
provision, other income (expense), net, and interest expense, net). Performance measures derived from OIBDA are also used
in the Company’s annual incentive compensation programs. In addition, this measure is commonly used by analysts,
investors and others in evaluating the Company’s performance.
This measure has inherent limitations. For example, OIBDA does not reflect capital expenditures or the periodic costs of
certain capitalized assets used in generating revenue. To compensate for such limitations, management evaluates
performance through, among other measures, various cash flow measures, which reflect capital expenditure decisions, and
net income attributable to TWC shareholders, which reflects the periodic costs of capitalized assets. OIBDA also fails to
reflect the significant costs borne by the Company for income taxes and debt servicing costs, the share of OIBDA attributable
to noncontrolling interests, the results of the Company’s equity investments and other non-operational income or expense.
Management compensates for these limitations by using other analytics such as a review of net income attributable to TWC
shareholders.
This non-GAAP measure should be considered in addition to, not as a substitute for, the Company’s Operating Income
and net income attributable to TWC shareholders, as well as other measures of financial performance reported in accordance
with GAAP, and may not be comparable to similarly titled measures used by other companies.
39