Time Warner Cable 2012 Annual Report Download - page 66
Download and view the complete annual report
Please find page 66 of the 2012 Time Warner Cable annual report below. You can navigate through the pages in the report by either clicking on the pages listed below, or by using the keyword search tool below to find specific information within the annual report.-
 1
1 -
2
-
3
-
4
-
5
-
6
-
7
-
8
-
9
-
10
-
11
-
12
-
13
-
14
-
15
-
16
-
17
-
18
-
19
-
20
-
21
-
22
-
23
-
24
-
25
-
26
-
27
-
28
-
29
-
30
-
31
-
32
-
33
-
34
-
35
-
36
-
37
-
38
-
39
-
40
-
41
-
42
-
43
-
44
-
45
-
46
-
47
-
48
-
49
-
50
-
51
-
52
-
53
-
54
-
55
-
 56
56 -
 57
57 -
 58
58 -
 59
59 -
 60
60 -
 61
61 -
 62
62 -
 63
63 -
 64
64 -
 65
65 -
 66
66 -
 67
67 -
 68
68 -
 69
69 -
 70
70 -
 71
71 -
 72
72 -
 73
73 -
 74
74 -
 75
75 -
 76
76 -
77
-
78
-
79
-
80
-
81
-
82
-
83
-
84
-
85
-
86
-
87
-
88
-
89
-
90
-
91
-
92
-
93
-
94
-
95
-
96
-
97
-
98
-
99
-
100
-
101
-
102
-
103
-
104
-
105
-
106
-
107
-
108
-
109
-
110
-
111
-
112
-
113
-
114
-
115
-
116
-
117
-
118
-
119
-
120
-
121
-
122
-
123
-
124
-
125
-
126
-
127
-
128
-
129
-
130
-
131
-
132
-
133
-
134
-
135
-
136
-
137
-
138
-
139
-
140
-
141
-
142
-
143
-
144
-
145
-
146
-
147
-
148
-
149
-
150
-
151
-
152
-
153
-
154
 |
 |

TIME WARNER CABLE INC.
MANAGEMENT’S DISCUSSION AND ANALYSIS OF RESULTS
OF OPERATIONS AND FINANCIAL CONDITION—(Continued)
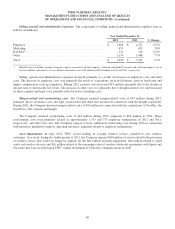
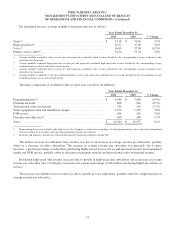
Absent the impacts of the above items, the effective tax rates would have been 39.5% and 40.3% for 2011 and 2010,
respectively.
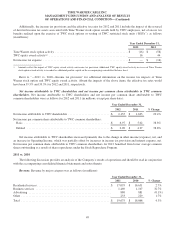
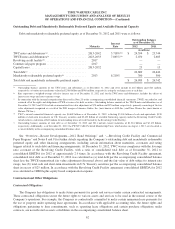
Net income attributable to TWC shareholders and net income per common share attributable to TWC common
shareholders. Net income attributable to TWC shareholders and net income per common share attributable to TWC
common shareholders were as follows for 2011 and 2010 (in millions, except per share data):
Year Ended December 31,
2011 2010 % Change
Net income attributable to TWC shareholders .........................$ 1,665 $ 1,308 27.3%
Net income per common share attributable to TWC common shareholders:
Basic .......................................................$ 5.02 $ 3.67 36.8%
Diluted ......................................................$ 4.97 $ 3.64 36.5%
Net income attributable to TWC shareholders increased primarily due to an increase in Operating Income and a decrease
in income tax provision, which was partially offset by an increase in interest expense, net. Net income per common share
attributable to TWC common shareholders for 2011 benefited from lower average common shares outstanding as a result of
share repurchases under the Stock Repurchase Program.
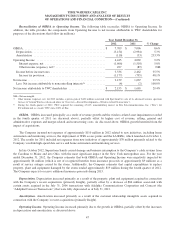
FINANCIAL CONDITION AND LIQUIDITY
Management believes that cash generated by or available to TWC should be sufficient to fund its capital and liquidity
needs for the next twelve months and for the foreseeable future thereafter, including quarterly dividend payments, common
stock repurchases and maturities of long-term debt and the TW NY Cable Preferred Membership Units (defined below).
TWC’s sources of cash include cash and equivalents on hand, short-term investments in U.S. Treasury securities, cash
provided by operating activities and borrowing capacity under the Revolving Credit Facility and the Commercial Paper
Program, as well as access to capital markets.
The Company generally invests its cash and equivalents in a combination of money market, government and treasury
funds, as well as other similar instruments, in accordance with the Company’s investment policy of diversifying its
investments and limiting the amount of its investments in a single entity or fund. As of December 31, 2012, nearly all of the
Company’s cash and equivalents was invested in money market funds and income earning bank deposits, including
certificates of deposit. Additionally, as of December 31, 2012, the Company held short-term investments in U.S. Treasury
securities.
TWC’s unused committed financial capacity was $6.889 billion as of December 31, 2012, reflecting $3.304 billion of
cash and equivalents, $150 million of short-term investments in U.S. Treasury securities and $3.435 billion of available
borrowing capacity under the Revolving Credit Facility.
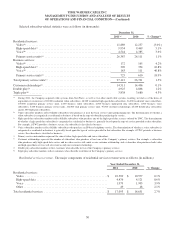
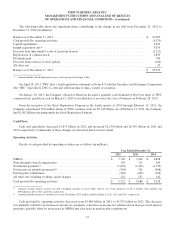
Current Financial Condition
As of December 31, 2012, the Company had $26.689 billion of debt, $3.304 billion of cash and equivalents,
$150 million of short-term investments in U.S. Treasury securities (net debt of $23.235 billion, defined as total debt less cash
and equivalents and short-term investments in U.S. Treasury securities), $300 million of mandatorily redeemable non-voting
Series A Preferred Equity Membership Units (the “TW NY Cable Preferred Membership Units”) issued by a subsidiary of
TWC, Time Warner NY Cable LLC (“TW NY Cable”), and $7.279 billion of total TWC shareholders’ equity. As of
December 31, 2011, the Company had $26.442 billion of debt, $5.177 billion of cash and equivalents (net debt of $21.265
billion), $300 million of TW NY Cable Preferred Membership Units and $7.530 billion of total TWC shareholders’ equity.
56