Time Warner Cable 2012 Annual Report Download - page 57
Download and view the complete annual report
Please find page 57 of the 2012 Time Warner Cable annual report below. You can navigate through the pages in the report by either clicking on the pages listed below, or by using the keyword search tool below to find specific information within the annual report.-
 1
1 -
2
-
3
-
4
-
5
-
6
-
7
-
8
-
9
-
10
-
11
-
12
-
13
-
14
-
15
-
16
-
17
-
18
-
19
-
20
-
21
-
22
-
23
-
24
-
25
-
26
-
27
-
28
-
29
-
30
-
31
-
32
-
33
-
34
-
35
-
36
-
37
-
38
-
39
-
40
-
41
-
42
-
43
-
44
-
45
-
46
-
 47
47 -
 48
48 -
 49
49 -
 50
50 -
 51
51 -
 52
52 -
 53
53 -
 54
54 -
 55
55 -
 56
56 -
 57
57 -
 58
58 -
 59
59 -
 60
60 -
 61
61 -
 62
62 -
 63
63 -
 64
64 -
 65
65 -
 66
66 -
 67
67 -
68
-
69
-
70
-
71
-
72
-
73
-
74
-
75
-
76
-
77
-
78
-
79
-
80
-
81
-
82
-
83
-
84
-
85
-
86
-
87
-
88
-
89
-
90
-
91
-
92
-
93
-
94
-
95
-
96
-
97
-
98
-
99
-
100
-
101
-
102
-
103
-
104
-
105
-
106
-
107
-
108
-
109
-
110
-
111
-
112
-
113
-
114
-
115
-
116
-
117
-
118
-
119
-
120
-
121
-
122
-
123
-
124
-
125
-
126
-
127
-
128
-
129
-
130
-
131
-
132
-
133
-
134
-
135
-
136
-
137
-
138
-
139
-
140
-
141
-
142
-
143
-
144
-
145
-
146
-
147
-
148
-
149
-
150
-
151
-
152
-
153
-
154
 |
 |

TIME WARNER CABLE INC.
MANAGEMENT’S DISCUSSION AND ANALYSIS OF RESULTS
OF OPERATIONS AND FINANCIAL CONDITION—(Continued)
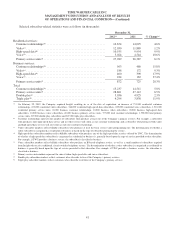
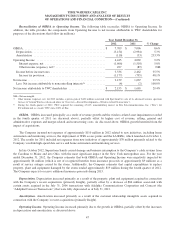
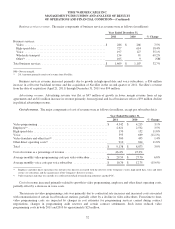
Reconciliation of OIBDA to Operating Income. The following table reconciles OIBDA to Operating Income. In
addition, the table provides the components from Operating Income to net income attributable to TWC shareholders for
purposes of the discussions that follow (in millions):
Year Ended December 31,
2012 2011 % Change
OIBDA ........................................................$ 7,709 $ 7,096 8.6%
Depreciation .................................................. (3,154) (2,994) 5.3%
Amortization ................................................. (110) (33) 233.3%
Operating Income ............................................... 4,445 4,069 9.2%
Interest expense, net ......................................... (1,606) (1,518) 5.8%
Other income (expense), net(a) .................................. 497 (89) NM
Income before income taxes ..................................... 3,336 2,462 35.5%
Income tax provision ......................................... (1,177) (795) 48.1%
Net income ..................................................... 2,159 1,667 29.5%
Less: Net income attributable to noncontrolling interests(b) ............. (4) (2) 100.0%
Net income attributable to TWC shareholders .........................$ 2,155 $ 1,665 29.4%
NM—Not meaningful.
(a) Other income (expense), net, for 2012 includes a pretax gain of $430 million associated with SpectrumCo’s sale of its advanced wireless spectrum
licenses to Verizon Wireless (discussed above in “Overview—Recent Developments—Wireless-related Transactions”).
(b) During the fourth quarter of 2012, TWC acquired the remaining 45.81% noncontrolling interest in Erie Telecommunications, Inc. (“Erie”) for
$32 million and, as a result, TWC owns 100% of Erie.
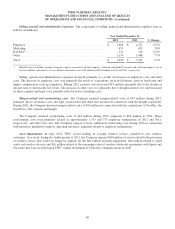
OIBDA. OIBDA increased principally as a result of revenue growth and the wireless-related asset impairment recorded
in the fourth quarter of 2011 (as discussed above), partially offset by higher cost of revenue, selling, general and
administrative expenses and merger-related and restructuring costs. As discussed above, OIBDA growth benefited from the
impact of acquisitions.
The Company incurred net expenses of approximately $110 million in 2012 related to new initiatives, including home
automation and monitoring services, the deployment of WiFi access points and the LA RSNs, which launched on October 1,
2012. The results for 2011 included net expenses from new initiatives of approximately $70 million primarily related to the
Company’s mobile high-speed data service and home automation and monitoring services.
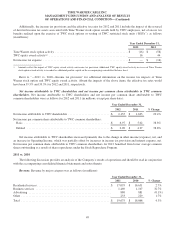
In late October 2012, Superstorm Sandy caused damage and business interruption to the Company’s cable systems from
the Carolinas to Maine and into Ohio, with the most significant impact in the New York metropolitan area. For the year
ended December 31, 2012, the Company estimates that both OIBDA and Operating Income were negatively impacted by
approximately $6 million (which is net of recognized benefits from insurance proceeds of approximately $9 million) as a
result of service outages caused by the storm. Additionally, the Company estimates that capital expenditures to replace
property, plant and equipment damaged by the storm totaled approximately $19 million during the fourth quarter of 2012.
The Company expects to receive additional insurance proceeds during 2013.
Depreciation. Depreciation increased primarily as a result of the property, plant and equipment acquired in connection
with the Company’s recent acquisitions (primarily Insight), partially offset by a decrease of $86 million associated with
certain assets acquired in the July 31, 2006 transactions with Adelphia Communications Corporation and Comcast (the
“Adelphia/Comcast Transactions”) that were fully depreciated as of July 31, 2012.
Amortization. Amortization increased primarily as a result of the customer relationship intangible assets acquired in
connection with the Company’s recent acquisitions (primarily Insight).
Operating Income. Operating Income increased primarily due to the growth in OIBDA, partially offset by the increases
in depreciation and amortization, as discussed above.
47