Time Warner Cable 2012 Annual Report Download - page 59
Download and view the complete annual report
Please find page 59 of the 2012 Time Warner Cable annual report below. You can navigate through the pages in the report by either clicking on the pages listed below, or by using the keyword search tool below to find specific information within the annual report.-
 1
1 -
2
-
3
-
4
-
5
-
6
-
7
-
8
-
9
-
10
-
11
-
12
-
13
-
14
-
15
-
16
-
17
-
18
-
19
-
20
-
21
-
22
-
23
-
24
-
25
-
26
-
27
-
28
-
29
-
30
-
31
-
32
-
33
-
34
-
35
-
36
-
37
-
38
-
39
-
40
-
41
-
42
-
43
-
44
-
45
-
46
-
47
-
48
-
 49
49 -
 50
50 -
 51
51 -
 52
52 -
 53
53 -
 54
54 -
 55
55 -
 56
56 -
 57
57 -
 58
58 -
 59
59 -
 60
60 -
 61
61 -
 62
62 -
 63
63 -
 64
64 -
 65
65 -
 66
66 -
 67
67 -
 68
68 -
 69
69 -
70
-
71
-
72
-
73
-
74
-
75
-
76
-
77
-
78
-
79
-
80
-
81
-
82
-
83
-
84
-
85
-
86
-
87
-
88
-
89
-
90
-
91
-
92
-
93
-
94
-
95
-
96
-
97
-
98
-
99
-
100
-
101
-
102
-
103
-
104
-
105
-
106
-
107
-
108
-
109
-
110
-
111
-
112
-
113
-
114
-
115
-
116
-
117
-
118
-
119
-
120
-
121
-
122
-
123
-
124
-
125
-
126
-
127
-
128
-
129
-
130
-
131
-
132
-
133
-
134
-
135
-
136
-
137
-
138
-
139
-
140
-
141
-
142
-
143
-
144
-
145
-
146
-
147
-
148
-
149
-
150
-
151
-
152
-
153
-
154
 |
 |

TIME WARNER CABLE INC.
MANAGEMENT’S DISCUSSION AND ANALYSIS OF RESULTS
OF OPERATIONS AND FINANCIAL CONDITION—(Continued)
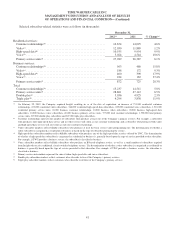
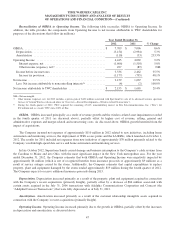
Additionally, the income tax provisions and the effective tax rates for 2012 and 2011 include the impact of the reversal
of deferred income tax assets associated with Time Warner stock option awards held by TWC employees, net of excess tax
benefits realized upon the exercise of TWC stock options or vesting of TWC restricted stock units (“RSUs”), as follows
(in millions):
Year Ended December 31,
2012 2011
Time Warner stock option activity ..................................................$ (16) $ (58)
TWC equity award activity(a) ...................................................... 16 44
Net income tax expense ..........................................................$ — $ (14)
(a) Amounts reflect the impact of TWC equity award activity on income tax provision. Additional TWC equity award activity in excess of Time Warner
stock option award activity is recorded as additional paid-in capital on the accompanying consolidated balance sheet.
Refer to “—2011 vs. 2010—Income tax provision” for additional information on the income tax impacts of Time
Warner stock option and TWC equity award activity. Absent the impacts of the above items, the effective tax rates would
have been 39.5% and 39.3% for 2012 and 2011, respectively.
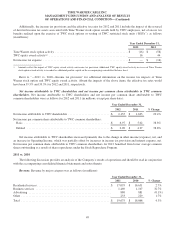
Net income attributable to TWC shareholders and net income per common share attributable to TWC common
shareholders. Net income attributable to TWC shareholders and net income per common share attributable to TWC
common shareholders were as follows for 2012 and 2011 (in millions, except per share data):
Year Ended December 31,
2012 2011 % Change
Net income attributable to TWC shareholders .............................$ 2,155 $ 1,665 29.4%
Net income per common share attributable to TWC common shareholders:
Basic ...........................................................$ 6.97 $ 5.02 38.8%
Diluted .........................................................$ 6.90 $ 4.97 38.8%
Net income attributable to TWC shareholders increased primarily due to the change in other income (expense), net, and
an increase in Operating Income, which was partially offset by increases in income tax provision and interest expense, net.
Net income per common share attributable to TWC common shareholders for 2012 benefited from lower average common
shares outstanding as a result of share repurchases under the Stock Repurchase Program.
2011 vs. 2010
The following discussion provides an analysis of the Company’s results of operations and should be read in conjunction
with the accompanying consolidated financial statements and notes thereto.
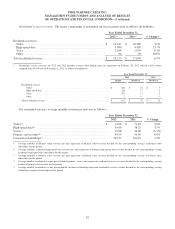
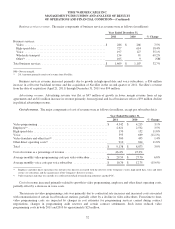
Revenue. Revenue by major category was as follows (in millions):
Year Ended December 31,
2011 2010 % Change
Residential services ..................................................$ 17,093 $ 16,651 2.7%
Business services ................................................... 1,469 1,107 32.7%
Advertising ........................................................ 880 881 (0.1%)
Other ............................................................. 233 229 1.7%
Total .............................................................$ 19,675 $ 18,868 4.3%
49