Time Warner Cable 2012 Annual Report Download - page 113
Download and view the complete annual report
Please find page 113 of the 2012 Time Warner Cable annual report below. You can navigate through the pages in the report by either clicking on the pages listed below, or by using the keyword search tool below to find specific information within the annual report.-
 1
1 -
2
-
3
-
4
-
5
-
6
-
7
-
8
-
9
-
10
-
11
-
12
-
13
-
14
-
15
-
16
-
17
-
18
-
19
-
20
-
21
-
22
-
23
-
24
-
25
-
26
-
27
-
28
-
29
-
30
-
31
-
32
-
33
-
34
-
35
-
36
-
37
-
38
-
39
-
40
-
41
-
42
-
43
-
44
-
45
-
46
-
47
-
48
-
49
-
50
-
51
-
52
-
53
-
54
-
55
-
56
-
57
-
58
-
59
-
60
-
61
-
62
-
63
-
64
-
65
-
66
-
67
-
68
-
69
-
70
-
71
-
72
-
73
-
74
-
75
-
76
-
77
-
78
-
79
-
80
-
81
-
82
-
83
-
84
-
85
-
86
-
87
-
88
-
89
-
90
-
91
-
92
-
93
-
94
-
95
-
96
-
97
-
98
-
99
-
100
-
101
-
102
-
 103
103 -
 104
104 -
 105
105 -
 106
106 -
 107
107 -
 108
108 -
 109
109 -
 110
110 -
 111
111 -
 112
112 -
 113
113 -
 114
114 -
 115
115 -
 116
116 -
 117
117 -
 118
118 -
 119
119 -
 120
120 -
 121
121 -
 122
122 -
 123
123 -
124
-
125
-
126
-
127
-
128
-
129
-
130
-
131
-
132
-
133
-
134
-
135
-
136
-
137
-
138
-
139
-
140
-
141
-
142
-
143
-
144
-
145
-
146
-
147
-
148
-
149
-
150
-
151
-
152
-
153
-
154
 |
 |

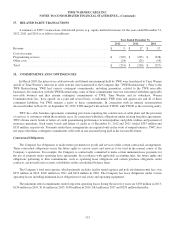
TIME WARNER CABLE INC.
NOTES TO CONSOLIDATED FINANCIAL STATEMENTS—(Continued)
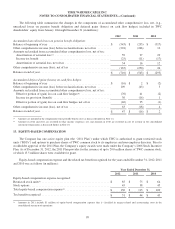
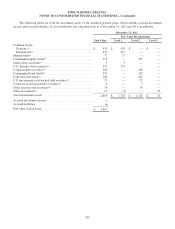
Pretax amounts recognized in the consolidated balance sheet as of December 31, 2012 and 2011 consisted of (in
millions):
December 31,
2012 2011
Current liability .................................................................$ (5) $ (4)
Noncurrent liability .............................................................. (204) (46)
Total amounts recognized in liabilities ...............................................$ (209) $ (50)
Accumulated other comprehensive loss:
Net actuarial loss ................................................................$ (1,155) $ (890)
Prior service cost ................................................................ (1) (1)
Total amounts recognized in TWC shareholders’ equity .................................
$ (1,156) $ (891)
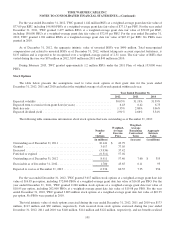
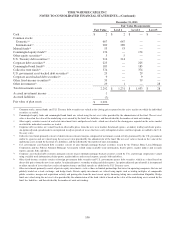
The components of net periodic benefit costs for the years ended December 31, 2012, 2011 and 2010 were as follows (in
millions):
Year Ended December 31,
2012 2011 2010
Service cost ........................................................$ 169 $ 132 $ 115
Interest cost ........................................................ 131 114 100
Expected return on plan assets ......................................... (176) (150) (127)
Amounts amortized .................................................. 59 27 29
Net periodic benefit costs .............................................
$ 183 $ 123 $ 117
The estimated amounts that will be amortized from accumulated other comprehensive loss, net, into net periodic benefit
costs in 2013 include an actuarial loss of $77 million.
Weighted-average assumptions used to determine benefit obligations as of December 31, 2012, 2011 and 2010 were as
follows:
2012 2011 2010
Discount rate ....................................................... 4.31% 5.21% 5.90%
Rate of compensation increase ......................................... 4.75% 5.25% 5.25%
The discount rate used to determine benefit obligations was determined by the matching of plan liability cash flows to a
portfolio of bonds individually selected from a large population of high-quality corporate bonds.
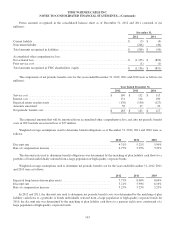
Weighted-average assumptions used to determine net periodic benefit cost for the years ended December 31, 2012, 2011
and 2010 were as follows:
2012 2011 2010
Expected long-term return on plan assets ................................. 7.75% 8.00% 8.00%
Discount rate ....................................................... 5.21% 5.90% 6.16%
Rate of compensation increase ......................................... 5.25% 5.25% 5.25%
In 2012 and 2011, the discount rate used to determine net periodic benefit costs was determined by the matching of plan
liability cash flows to a portfolio of bonds individually selected from a large population of high-quality corporate bonds. In
2010, the discount rate was determined by the matching of plan liability cash flows to a pension yield curve constructed of a
large population of high-quality corporate bonds.
103