Time Warner Cable 2012 Annual Report Download - page 53
Download and view the complete annual report
Please find page 53 of the 2012 Time Warner Cable annual report below. You can navigate through the pages in the report by either clicking on the pages listed below, or by using the keyword search tool below to find specific information within the annual report.-
 1
1 -
2
-
3
-
4
-
5
-
6
-
7
-
8
-
9
-
10
-
11
-
12
-
13
-
14
-
15
-
16
-
17
-
18
-
19
-
20
-
21
-
22
-
23
-
24
-
25
-
26
-
27
-
28
-
29
-
30
-
31
-
32
-
33
-
34
-
35
-
36
-
37
-
38
-
39
-
40
-
41
-
42
-
 43
43 -
 44
44 -
 45
45 -
 46
46 -
 47
47 -
 48
48 -
 49
49 -
 50
50 -
 51
51 -
 52
52 -
 53
53 -
 54
54 -
 55
55 -
 56
56 -
 57
57 -
 58
58 -
 59
59 -
 60
60 -
 61
61 -
 62
62 -
 63
63 -
64
-
65
-
66
-
67
-
68
-
69
-
70
-
71
-
72
-
73
-
74
-
75
-
76
-
77
-
78
-
79
-
80
-
81
-
82
-
83
-
84
-
85
-
86
-
87
-
88
-
89
-
90
-
91
-
92
-
93
-
94
-
95
-
96
-
97
-
98
-
99
-
100
-
101
-
102
-
103
-
104
-
105
-
106
-
107
-
108
-
109
-
110
-
111
-
112
-
113
-
114
-
115
-
116
-
117
-
118
-
119
-
120
-
121
-
122
-
123
-
124
-
125
-
126
-
127
-
128
-
129
-
130
-
131
-
132
-
133
-
134
-
135
-
136
-
137
-
138
-
139
-
140
-
141
-
142
-
143
-
144
-
145
-
146
-
147
-
148
-
149
-
150
-
151
-
152
-
153
-
154
 |
 |

TIME WARNER CABLE INC.
MANAGEMENT’S DISCUSSION AND ANALYSIS OF RESULTS
OF OPERATIONS AND FINANCIAL CONDITION—(Continued)
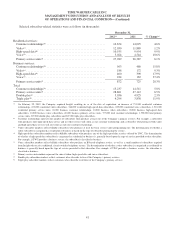
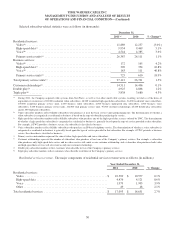
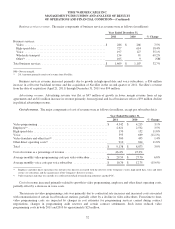
The major components of residential video revenue were as follows (in millions):
Year Ended December 31,
2012(a) 2011(a) % Change(a)
Programming tiers(b) .................................................$ 7,170 $ 6,944 3.3%
Premium networks .................................................. 808 808 —
Transactional video-on-demand ........................................ 290 339 (14.5%)
Video equipment rental and installation charges ........................... 1,469 1,372 7.1%
DVR service ....................................................... 675 638 5.8%
Franchise and other fees(c) ............................................. 505 488 3.5%
Total .............................................................$ 10,917 $ 10,589 3.1%
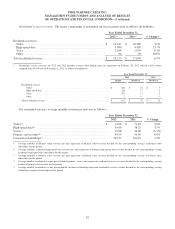
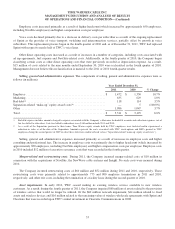
(a) Residential video revenue for 2012 and 2011 includes revenue from Insight since its acquisition on February 29, 2012 and the cable systems acquired
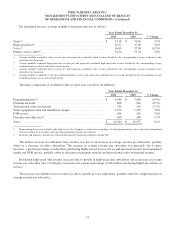
from NewWave on November 1, 2011, as follows (in millions):
Year Ended December 31,
2012 2011
Insight NewWave NewWave
Programming tiers(b) .............................................................$ 341 $ 38 $ 7
Premium networks .............................................................. 25 2 —
Transactional video-on-demand .................................................... 15 — —
Video equipment rental and installation charges ....................................... 46 1 —
DVR service ................................................................... 24 2 —
Franchise and other fees(c) ......................................................... 11 1 —
Total .........................................................................$ 462 $ 44 $ 7
(b) Programming tier revenue includes subscriber fees for the Company’s various tiers or packages of video programming services generally distinguished
from one another by the number and type of programming networks they include.
(c) Franchise and other fees include fees collected on behalf of franchising authorities and the FCC.
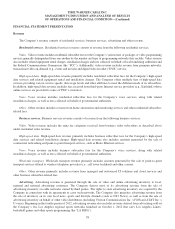
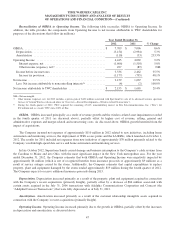
The increase in residential video revenue was primarily due to acquisitions and an increase in average revenue per
subscriber, partially offset by an organic decrease in video subscribers. The increase in such average revenue per subscriber
was primarily due to price increases, a greater percentage of subscribers purchasing higher-priced tiers of service and
increased revenue from equipment rentals, partially offset by decreases in transactional video-on-demand and premium
network revenue.
Residential high-speed data revenue increased due to organic growth in high-speed data subscribers and an increase in
average revenue per subscriber, as well as acquisition-related growth. The increase in average revenue per subscriber was
primarily due to price increases (including equipment rental charges) and a greater percentage of subscribers purchasing
higher-priced tiers of service.
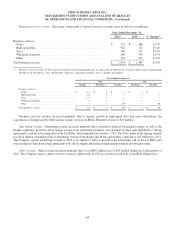
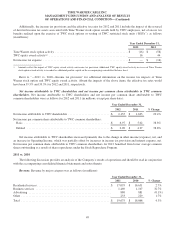
The increase in residential voice revenue was due to acquisition-related and organic growth in voice subscribers,
partially offset by a decrease in average revenue per subscriber.
The Company expects that residential services revenue will increase in 2013, primarily due to growth in residential
high-speed data revenue, which is expected to increase as a result of continued growth in subscribers and average revenue
per subscriber. The increase in residential high-speed data revenue is expected to be partially offset by a decline in residential
video revenue, primarily as a result of a continued decline in residential video subscribers. Residential services revenue in
2013 will also benefit from an additional two months of revenue associated with Insight.
43