Time Warner Cable 2012 Annual Report Download - page 69
Download and view the complete annual report
Please find page 69 of the 2012 Time Warner Cable annual report below. You can navigate through the pages in the report by either clicking on the pages listed below, or by using the keyword search tool below to find specific information within the annual report.-
 1
1 -
2
-
3
-
4
-
5
-
6
-
7
-
8
-
9
-
10
-
11
-
12
-
13
-
14
-
15
-
16
-
17
-
18
-
19
-
20
-
21
-
22
-
23
-
24
-
25
-
26
-
27
-
28
-
29
-
30
-
31
-
32
-
33
-
34
-
35
-
36
-
37
-
38
-
39
-
40
-
41
-
42
-
43
-
44
-
45
-
46
-
47
-
48
-
49
-
50
-
51
-
52
-
53
-
54
-
55
-
56
-
57
-
58
-
 59
59 -
 60
60 -
 61
61 -
 62
62 -
 63
63 -
 64
64 -
 65
65 -
 66
66 -
 67
67 -
 68
68 -
 69
69 -
 70
70 -
 71
71 -
 72
72 -
 73
73 -
 74
74 -
 75
75 -
 76
76 -
 77
77 -
 78
78 -
 79
79 -
80
-
81
-
82
-
83
-
84
-
85
-
86
-
87
-
88
-
89
-
90
-
91
-
92
-
93
-
94
-
95
-
96
-
97
-
98
-
99
-
100
-
101
-
102
-
103
-
104
-
105
-
106
-
107
-
108
-
109
-
110
-
111
-
112
-
113
-
114
-
115
-
116
-
117
-
118
-
119
-
120
-
121
-
122
-
123
-
124
-
125
-
126
-
127
-
128
-
129
-
130
-
131
-
132
-
133
-
134
-
135
-
136
-
137
-
138
-
139
-
140
-
141
-
142
-
143
-
144
-
145
-
146
-
147
-
148
-
149
-
150
-
151
-
152
-
153
-
154
 |
 |

TIME WARNER CABLE INC.
MANAGEMENT’S DISCUSSION AND ANALYSIS OF RESULTS
OF OPERATIONS AND FINANCIAL CONDITION—(Continued)
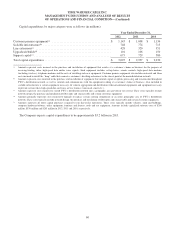
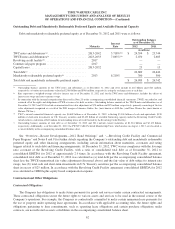
Investing Activities
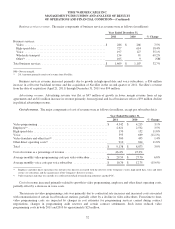
Details of cash used by investing activities are as follows (in millions):
Year Ended December 31,
2012 2011 2010
Capital expenditures .................................................$ (3,095) $ (2,937) $ (2,930)
Acquisitions and investments, net of cash acquired and distributions received:
Insight acquisition ............................................... (1,339) — —
NaviSite acquisition ............................................. — (263) —
NewWave cable systems acquisition ................................ — (259) —
Other cable system acquisitions .................................... — (38) —
Sterling Entertainment Enterprises, LLC(a) ............................ 88 3 65
Canoe(b) ....................................................... (8) (17) (21)
All other ...................................................... (49) (56) 4
Proceeds from SpectrumCo’s sale of spectrum licenses ..................... 1,112 — —
Proceeds from sale of investment in Clearwire ............................ 64 — —
Short-term investments in U.S. Treasury securities ......................... (150) — —
Other investing activities ............................................. 32 37 10
Cash used by investing activities .......................................$ (3,345) $ (3,530) $ (2,872)
(a) Amounts represent distributions received from Sterling Entertainment Enterprises, LLC (doing business as SportsNet New York), an equity-method
investee. During the first quarter of 2012, the Company made a loan of $40 million to SportsNet New York, which was repaid during the fourth quarter
of 2012.
(b) Amounts represent investments in Canoe, an equity-method investee engaged in the development of advanced advertising platforms. During the first
quarter of 2012, Canoe announced a restructuring that significantly curtailed its operations.
Cash used by investing activities decreased from $3.530 billion in 2011 to $3.345 billion in 2012, principally due to the
proceeds from the sale of SpectrumCo licenses, partially offset by increases in acquisitions and investments, net and capital
expenditures, as well as the 2012 short-term investments in U.S. Treasury securities. Acquisitions and investments, net, in
2012 primarily included the Insight acquisition, while acquisitions and investments, net, in 2011 primarily included the
acquisitions of NaviSite and the NewWave cable systems. Capital expenditures in 2012 included approximately $100 million
of Insight-related capital spending.
Cash used by investing activities increased from $2.872 billion in 2010 to $3.530 billion in 2011. This increase was
principally due to the acquisitions of NaviSite and the NewWave cable systems.
59