Time Warner Cable 2011 Annual Report Download - page 80
Download and view the complete annual report
Please find page 80 of the 2011 Time Warner Cable annual report below. You can navigate through the pages in the report by either clicking on the pages listed below, or by using the keyword search tool below to find specific information within the annual report.-
 1
1 -
2
-
3
-
4
-
5
-
6
-
7
-
8
-
9
-
10
-
11
-
12
-
13
-
14
-
15
-
16
-
17
-
18
-
19
-
20
-
21
-
22
-
23
-
24
-
25
-
26
-
27
-
28
-
29
-
30
-
31
-
32
-
33
-
34
-
35
-
36
-
37
-
38
-
39
-
40
-
41
-
42
-
43
-
44
-
45
-
46
-
47
-
48
-
49
-
50
-
51
-
52
-
53
-
54
-
55
-
56
-
57
-
58
-
59
-
60
-
61
-
62
-
63
-
64
-
65
-
66
-
67
-
68
-
69
-
 70
70 -
 71
71 -
 72
72 -
 73
73 -
 74
74 -
 75
75 -
 76
76 -
 77
77 -
 78
78 -
 79
79 -
 80
80 -
 81
81 -
 82
82 -
 83
83 -
 84
84 -
 85
85 -
 86
86 -
 87
87 -
 88
88 -
 89
89 -
 90
90 -
91
-
92
-
93
-
94
-
95
-
96
-
97
-
98
-
99
-
100
-
101
-
102
-
103
-
104
-
105
-
106
-
107
-
108
-
109
-
110
-
111
-
112
-
113
-
114
-
115
-
116
-
117
-
118
-
119
-
120
-
121
-
122
-
123
-
124
-
125
-
126
-
127
-
128
-
129
-
130
-
131
-
132
-
133
-
134
-
135
-
136
-
137
-
138
-
139
-
140
-
141
-
142
-
143
-
144
-
145
-
146
-
147
-
148
 |
 |

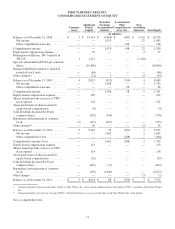
TIME WARNER CABLE INC.
CONSOLIDATED STATEMENT OF CASH FLOWS
Year Ended December 31,
2011 2010 2009
(in millions)
OPERATING ACTIVITIES
Net income ...................................................... $ 1,667 $ 1,313 $ 1,092
Adjustments for noncash and nonoperating items:
Depreciation ................................................... 2,994 2,961 2,836
Amortization ................................................... 33 168 249
Asset impairments .............................................. 60 — —
Pretax gain on sale of cable systems ................................ — — (12)
Loss from equity investments, net of cash distributions ................. 109 132 64
Deferred income taxes ........................................... 638 687 676
Equity-based compensation ....................................... 112 109 97
Excess tax benefit from equity-based compensation .................... (48) (19) —
Changes in operating assets and liabilities, net of acquisitions and dispositions:
Receivables .................................................... (25) (50) 2
Accounts payable and other liabilities ............................... 202 (177) 161
Other changes .................................................. (54) 94 14
Cash provided by operating activities ................................. 5,688 5,218 5,179
INVESTING ACTIVITIES
Acquisitions and investments, net of cash acquired and distributions received . . (630) 48 (88)
Capital expenditures ............................................... (2,937) (2,930) (3,231)
Other investing activities ........................................... 37 10 12
Cash used by investing activities ..................................... (3,530) (2,872) (3,307)
FINANCING ACTIVITIES
Short-term borrowings (repayments), net(a) .............................. — (1,261) 1,261
Borrowings(b) ..................................................... 3,227 1,872 12,037
Repayments(b) .................................................... (44) (8) (8,677)
Debt issuance costs ................................................ (25) (25) (34)
Proceeds from exercise of stock options ............................... 114 122 4
Taxes paid in lieu of shares issued for equity-based compensation ........... (29) (9) —
Excess tax benefit from equity-based compensation ...................... 48 19 —
Dividends paid ................................................... (642) (576) —
Repurchases of common stock ....................................... (2,657) (472) —
Payment of special cash dividend .................................... — — (10,856)
Other financing activities ........................................... (20) (9) (8)
Cash used by financing activities ..................................... (28) (347) (6,273)
Increase (decrease) in cash and equivalents ............................. 2,130 1,999 (4,401)
Cash and equivalents at beginning of year .............................. 3,047 1,048 5,449
Cash and equivalents at end of year ................................... $ 5,177 $ 3,047 $ 1,048
(a) Short-term borrowings (repayments), net, reflects borrowings under the Company’s commercial paper program with original maturities of three months
or less, net of repayments of such borrowings.
(b) Amounts represent borrowings and repayments related to debt instruments with original maturities greater than three months.
See accompanying notes.
72