Time Warner Cable 2011 Annual Report Download - page 58
Download and view the complete annual report
Please find page 58 of the 2011 Time Warner Cable annual report below. You can navigate through the pages in the report by either clicking on the pages listed below, or by using the keyword search tool below to find specific information within the annual report.-
 1
1 -
2
-
3
-
4
-
5
-
6
-
7
-
8
-
9
-
10
-
11
-
12
-
13
-
14
-
15
-
16
-
17
-
18
-
19
-
20
-
21
-
22
-
23
-
24
-
25
-
26
-
27
-
28
-
29
-
30
-
31
-
32
-
33
-
34
-
35
-
36
-
37
-
38
-
39
-
40
-
41
-
42
-
43
-
44
-
45
-
46
-
47
-
 48
48 -
 49
49 -
 50
50 -
 51
51 -
 52
52 -
 53
53 -
 54
54 -
 55
55 -
 56
56 -
 57
57 -
 58
58 -
 59
59 -
 60
60 -
 61
61 -
 62
62 -
 63
63 -
 64
64 -
 65
65 -
 66
66 -
 67
67 -
 68
68 -
69
-
70
-
71
-
72
-
73
-
74
-
75
-
76
-
77
-
78
-
79
-
80
-
81
-
82
-
83
-
84
-
85
-
86
-
87
-
88
-
89
-
90
-
91
-
92
-
93
-
94
-
95
-
96
-
97
-
98
-
99
-
100
-
101
-
102
-
103
-
104
-
105
-
106
-
107
-
108
-
109
-
110
-
111
-
112
-
113
-
114
-
115
-
116
-
117
-
118
-
119
-
120
-
121
-
122
-
123
-
124
-
125
-
126
-
127
-
128
-
129
-
130
-
131
-
132
-
133
-
134
-
135
-
136
-
137
-
138
-
139
-
140
-
141
-
142
-
143
-
144
-
145
-
146
-
147
-
148
 |
 |

TIME WARNER CABLE INC.
MANAGEMENT’S DISCUSSION AND ANALYSIS OF RESULTS
OF OPERATIONS AND FINANCIAL CONDITION—(Continued)
treatment resulted in shortened exercise periods for vested awards, generally one year from the date of the Separation;
however, certain awards expire over a five-year period from the date of the Separation. Deferred income tax assets were
established based on the Time Warner awards’ fair values, and a corresponding benefit to the Company’s income tax
provision was recognized over the awards’ service periods. For unexercised awards that expired “out of the money,” the fair
value was $0 and the Company received no tax deduction in connection with these awards. As a result, the previously-
recognized deferred income tax assets were written off through noncash charges to income tax expense during the periods in
which the awards expired. As noted above, the charges were reduced by excess tax benefits realized upon the exercise of
TWC stock options or vesting of TWC RSUs in the same year in which the charge was taken.
Absent the impacts of the above items, the effective tax rates would have been 39.5% and 40.3% for 2011 and 2010,
respectively.
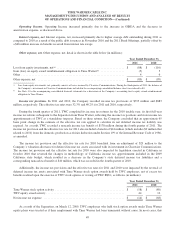
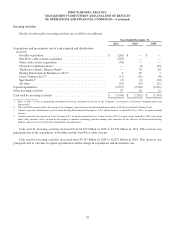
Net income attributable to TWC shareholders and net income per common share attributable to TWC common
shareholders. Net income attributable to TWC shareholders and net income per common share attributable to TWC common
shareholders were as follows for 2011 and 2010 (in millions, except per share data):
Year Ended December 31,
2011 2010 % Change
Net income attributable to TWC shareholders .......................... $ 1,665 $ 1,308 27.3%
Net income per common share attributable to TWC common shareholders:
Basic ........................................................ $ 5.02 $ 3.67 36.8%
Diluted ....................................................... $ 4.97 $ 3.64 36.5%
Net income attributable to TWC shareholders increased primarily due to an increase in Operating Income and a decrease
in income tax provision, which was partially offset by an increase in interest expense, net. Net income per common share
attributable to TWC common shareholders for 2011 benefited from lower average common shares outstanding as a result of
share repurchases under the Stock Repurchase Program.
2010 vs. 2009
The following discussion provides an analysis of the Company’s results of operations and should be read in conjunction
with the accompanying consolidated financial statements and notes thereto.
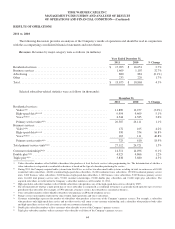
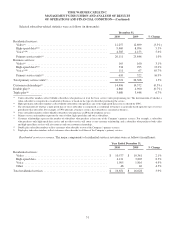
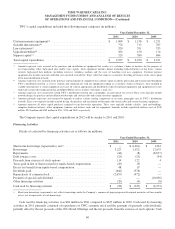
Revenues. Revenues by major category were as follows (in millions):
Year Ended December 31,
2010 2009 % Change
Residential services ............................................... $ 16,651 $ 16,028 3.9%
Business services ................................................. 1,107 916 20.9%
Advertising ..................................................... 881 702 25.5%
Other .......................................................... 229 222 3.2%
Total ........................................................... $ 18,868 $ 17,868 5.6%
50