Time Warner Cable 2011 Annual Report Download - page 59
Download and view the complete annual report
Please find page 59 of the 2011 Time Warner Cable annual report below. You can navigate through the pages in the report by either clicking on the pages listed below, or by using the keyword search tool below to find specific information within the annual report.-
 1
1 -
2
-
3
-
4
-
5
-
6
-
7
-
8
-
9
-
10
-
11
-
12
-
13
-
14
-
15
-
16
-
17
-
18
-
19
-
20
-
21
-
22
-
23
-
24
-
25
-
26
-
27
-
28
-
29
-
30
-
31
-
32
-
33
-
34
-
35
-
36
-
37
-
38
-
39
-
40
-
41
-
42
-
43
-
44
-
45
-
46
-
47
-
48
-
 49
49 -
 50
50 -
 51
51 -
 52
52 -
 53
53 -
 54
54 -
 55
55 -
 56
56 -
 57
57 -
 58
58 -
 59
59 -
 60
60 -
 61
61 -
 62
62 -
 63
63 -
 64
64 -
 65
65 -
 66
66 -
 67
67 -
 68
68 -
 69
69 -
70
-
71
-
72
-
73
-
74
-
75
-
76
-
77
-
78
-
79
-
80
-
81
-
82
-
83
-
84
-
85
-
86
-
87
-
88
-
89
-
90
-
91
-
92
-
93
-
94
-
95
-
96
-
97
-
98
-
99
-
100
-
101
-
102
-
103
-
104
-
105
-
106
-
107
-
108
-
109
-
110
-
111
-
112
-
113
-
114
-
115
-
116
-
117
-
118
-
119
-
120
-
121
-
122
-
123
-
124
-
125
-
126
-
127
-
128
-
129
-
130
-
131
-
132
-
133
-
134
-
135
-
136
-
137
-
138
-
139
-
140
-
141
-
142
-
143
-
144
-
145
-
146
-
147
-
148
 |
 |

TIME WARNER CABLE INC.
MANAGEMENT’S DISCUSSION AND ANALYSIS OF RESULTS
OF OPERATIONS AND FINANCIAL CONDITION—(Continued)
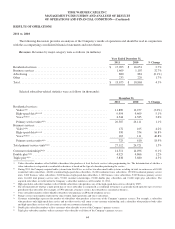
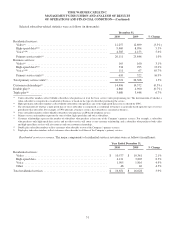
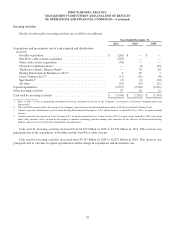
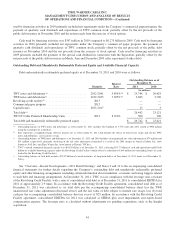
Selected subscriber-related statistics were as follows (in thousands):
December 31,
2010 2009 % Change
Residential services:
Video(a) ...................................................... 12,257 12,699 (3.5%)
High-speed data(b)(c) ............................................. 9,469 8,994 5.3%
Voice(c)(d) ..................................................... 4,385 4,153 5.6%
Primary service units(e) .......................................... 26,111 25,846 1.0%
Business services:
Video(a) ...................................................... 165 160 3.1%
High-speed data(b)(c) ............................................. 334 295 13.2%
Voice(c)(d) ..................................................... 111 67 65.7%
Primary service units(e) .......................................... 610 522 16.9%
Total primary service units(e) ........................................ 26,721 26,368 1.3%
Customer relationships(f) ........................................... 14,496 14,572 (0.5%)
Double play(g) ................................................... 4,866 4,900 (0.7%)
Triple play(h) .................................................... 3,680 3,448 6.7%
(a) Video subscriber numbers reflect billable subscribers who purchase at least the basic service video programming tier. The determination of whether a
video subscriber is categorized as residential or business is based on the type of subscriber purchasing the service.
(b) High-speed data subscriber numbers reflect billable subscribers who purchase any of the high-speed data services offered by TWC.
(c) The determination of whether a high-speed data or voice subscriber is categorized as residential or business is generally based upon the type of service
provided to that subscriber. For example, if TWC provides a business service, the subscriber is classified as business.
(d) Voice subscriber numbers reflect billable subscribers who purchase an IP-based telephony service.
(e) Primary service unit numbers represent the sum of video, high-speed data and voice subscribers.
(f) Customer relationships represent the number of subscribers who purchase at least one of the Company’s primary services. For example, a subscriber
who purchases only high-speed data service and no video service will count as one customer relationship, and a subscriber who purchases both video
and high-speed data services will also count as only one customer relationship.
(g) Double play subscriber numbers reflect customers who subscribe to two of the Company’s primary services.
(h) Triple play subscriber numbers reflect customers who subscribe to all three of the Company’s primary services.
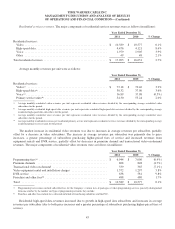
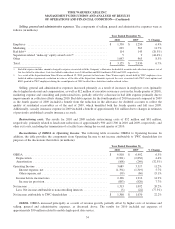
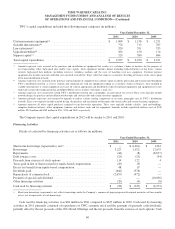
Residential services revenues. The major components of residential services revenues were as follows (in millions):
Year Ended December 31,
2010 2009 % Change
Residential services:
Video ........................................................ $ 10,577 $ 10,361 2.1%
High-speed data ................................................ 4,121 3,805 8.3%
Voice ........................................................ 1,905 1,816 4.9%
Other ........................................................ 48 46 4.3%
Total residential services ........................................... $ 16,651 $ 16,028 3.9%
51