Time Warner Cable 2011 Annual Report Download - page 71
Download and view the complete annual report
Please find page 71 of the 2011 Time Warner Cable annual report below. You can navigate through the pages in the report by either clicking on the pages listed below, or by using the keyword search tool below to find specific information within the annual report.-
 1
1 -
2
-
3
-
4
-
5
-
6
-
7
-
8
-
9
-
10
-
11
-
12
-
13
-
14
-
15
-
16
-
17
-
18
-
19
-
20
-
21
-
22
-
23
-
24
-
25
-
26
-
27
-
28
-
29
-
30
-
31
-
32
-
33
-
34
-
35
-
36
-
37
-
38
-
39
-
40
-
41
-
42
-
43
-
44
-
45
-
46
-
47
-
48
-
49
-
50
-
51
-
52
-
53
-
54
-
55
-
56
-
57
-
58
-
59
-
60
-
 61
61 -
 62
62 -
 63
63 -
 64
64 -
 65
65 -
 66
66 -
 67
67 -
 68
68 -
 69
69 -
 70
70 -
 71
71 -
 72
72 -
 73
73 -
 74
74 -
 75
75 -
 76
76 -
 77
77 -
 78
78 -
 79
79 -
 80
80 -
 81
81 -
82
-
83
-
84
-
85
-
86
-
87
-
88
-
89
-
90
-
91
-
92
-
93
-
94
-
95
-
96
-
97
-
98
-
99
-
100
-
101
-
102
-
103
-
104
-
105
-
106
-
107
-
108
-
109
-
110
-
111
-
112
-
113
-
114
-
115
-
116
-
117
-
118
-
119
-
120
-
121
-
122
-
123
-
124
-
125
-
126
-
127
-
128
-
129
-
130
-
131
-
132
-
133
-
134
-
135
-
136
-
137
-
138
-
139
-
140
-
141
-
142
-
143
-
144
-
145
-
146
-
147
-
148
 |
 |
TIME WARNER CABLE INC.
MANAGEMENT’S DISCUSSION AND ANALYSIS OF RESULTS
OF OPERATIONS AND FINANCIAL CONDITION—(Continued)
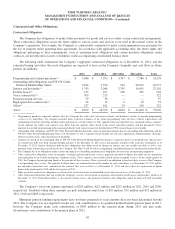
Contingent Commitments
TWC has cable franchise agreements containing provisions requiring the construction of cable plant and the provision
of services to customers within the franchise areas. In connection with these obligations under existing franchise agreements,
TWC obtains surety bonds or letters of credit guaranteeing performance to municipalities and public utilities and payment of
insurance premiums. Such surety bonds and letters of credit as of December 31, 2011 and 2010 totaled $335 million and
$322 million, respectively. Payments under these arrangements are required only in the event of nonperformance. TWC does
not expect that these contingent commitments will result in any amounts being paid in the foreseeable future.
MARKET RISK MANAGEMENT
Market risk is the potential gain/loss arising from changes in market rates and prices, such as interest rates.
Interest Rate Risk
Fixed-rate Debt and TW NY Cable Preferred Membership Units
As of December 31, 2011, TWC had fixed-rate debt and TW NY Cable Preferred Membership Units with an
outstanding balance of $26.430 billion (excluding the estimated fair value of the interest rate derivative transactions
discussed below) and an estimated fair value of $30.445 billion. Based on TWC’s fixed-rate debt obligations outstanding at
December 31, 2011, a 25 basis point increase or decrease in the level of interest rates would, respectively, decrease or
increase the fair value of the fixed-rate debt by approximately $572 million. Such potential increases or decreases are based
on certain simplifying assumptions, including a constant level of fixed-rate debt and an immediate, across-the-board increase
or decrease in the level of interest rates with no other subsequent changes for the remainder of the period.
Variable-rate Debt
As of December 31, 2011, TWC had no outstanding variable-rate debt.
Interest Rate Derivative Transactions
The Company is exposed to the market risk of adverse changes in interest rates. To manage the volatility relating to
these exposures, the Company’s policy is to maintain a mix of fixed-rate and variable-rate debt by entering into various
interest rate derivative transactions as described below to help achieve that mix. Using interest rate swaps, the Company
agrees to exchange, at specified intervals, the difference between fixed and variable interest amounts calculated by reference
to an agreed-upon notional principal amount.
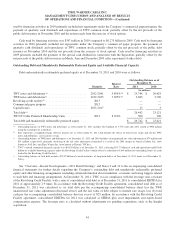
The following table summarizes the terms of the Company’s existing fixed to variable interest rate swaps as of
December 31, 2011:
Maturities ................................................................................ 2012-2017
Notional amount (in millions) ................................................................. $ 7,850
Average pay rate (variable based on LIBOR plus variable margins) ................................... 4.34%
Average receive rate (fixed) .................................................................. 6.34%
Estimated fair value of asset, net (in millions) .................................................... $ 297
The notional amounts of interest rate instruments, as presented in the above table, are used to measure interest to be paid
or received and do not represent the amount of exposure to credit loss. Interest rate swaps represent an integral part of the
Company’s interest rate risk management program and resulted in a decrease in interest expense, net, of $163 million in
2011.
63