Time Warner Cable 2011 Annual Report Download - page 109
Download and view the complete annual report
Please find page 109 of the 2011 Time Warner Cable annual report below. You can navigate through the pages in the report by either clicking on the pages listed below, or by using the keyword search tool below to find specific information within the annual report.-
 1
1 -
2
-
3
-
4
-
5
-
6
-
7
-
8
-
9
-
10
-
11
-
12
-
13
-
14
-
15
-
16
-
17
-
18
-
19
-
20
-
21
-
22
-
23
-
24
-
25
-
26
-
27
-
28
-
29
-
30
-
31
-
32
-
33
-
34
-
35
-
36
-
37
-
38
-
39
-
40
-
41
-
42
-
43
-
44
-
45
-
46
-
47
-
48
-
49
-
50
-
51
-
52
-
53
-
54
-
55
-
56
-
57
-
58
-
59
-
60
-
61
-
62
-
63
-
64
-
65
-
66
-
67
-
68
-
69
-
70
-
71
-
72
-
73
-
74
-
75
-
76
-
77
-
78
-
79
-
80
-
81
-
82
-
83
-
84
-
85
-
86
-
87
-
88
-
89
-
90
-
91
-
92
-
93
-
94
-
95
-
96
-
97
-
98
-
 99
99 -
 100
100 -
 101
101 -
 102
102 -
 103
103 -
 104
104 -
 105
105 -
 106
106 -
 107
107 -
 108
108 -
 109
109 -
 110
110 -
 111
111 -
 112
112 -
 113
113 -
 114
114 -
 115
115 -
 116
116 -
 117
117 -
 118
118 -
 119
119 -
120
-
121
-
122
-
123
-
124
-
125
-
126
-
127
-
128
-
129
-
130
-
131
-
132
-
133
-
134
-
135
-
136
-
137
-
138
-
139
-
140
-
141
-
142
-
143
-
144
-
145
-
146
-
147
-
148
 |
 |

TIME WARNER CABLE INC.
NOTES TO CONSOLIDATED FINANCIAL STATEMENTS—(Continued)
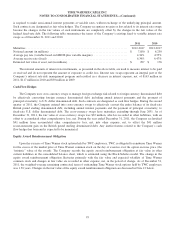
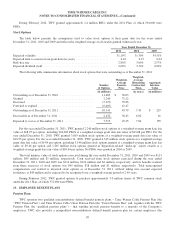
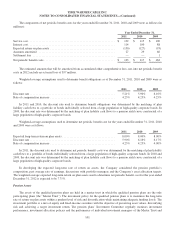
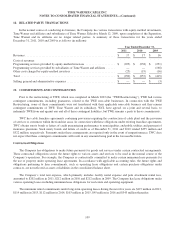
The components of net periodic benefit costs for the years ended December 31, 2011, 2010 and 2009 were as follows (in
millions):
Year Ended December 31,
2011 2010 2009
Service cost ........................................................... $ 132 $ 115 $ 100
Interest cost ........................................................... 114 100 88
Expected return on plan assets ............................................ (150) (127) (93)
Amounts amortized .................................................... 27 29 66
Settlement loss ........................................................ — — 1
Net periodic benefit costs ................................................ $ 123 $ 117 $ 162
The estimated amounts that will be amortized from accumulated other comprehensive loss, net, into net periodic benefit
costs in 2012 include an actuarial loss of $57 million.
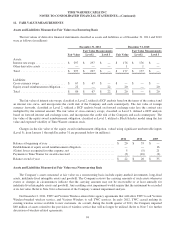
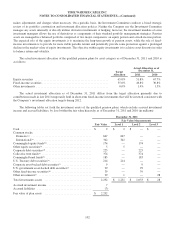
Weighted-average assumptions used to determine benefit obligations as of December 31, 2011, 2010 and 2009 were as
follows:
2011 2010 2009
Discount rate .......................................................... 5.21% 5.90% 6.16%
Rate of compensation increase ............................................ 4.25% 4.25% 4.25%
In 2011 and 2010, the discount rate used to determine benefit obligations was determined by the matching of plan
liability cash flows to a portfolio of bonds individually selected from a large population of high-quality corporate bonds. In
2009, the discount rate was determined by the matching of plan liability cash flows to a pension yield curve constructed of a
large population of high-quality corporate bonds.
Weighted-average assumptions used to determine net periodic benefit cost for the years ended December 31, 2011, 2010
and 2009 were as follows:
2011 2010 2009
Expected long-term return on plan assets .................................... 8.00% 8.00% 8.00%
Discount rate .......................................................... 5.90% 6.16% 6.17%
Rate of compensation increase ............................................ 4.25% 4.25% 4.00%
In 2011, the discount rate used to determine net periodic benefit costs was determined by the matching of plan liability
cash flows to a portfolio of bonds individually selected from a large population of high-quality corporate bonds. In 2010 and
2009, the discount rate was determined by the matching of plan liability cash flows to a pension yield curve constructed of a
large population of high-quality corporate bonds.
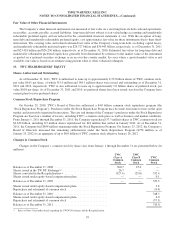
In developing the expected long-term rate of return on assets, the Company considered the pension portfolio’s
composition, past average rate of earnings, discussions with portfolio managers and the Company’s asset allocation targets.
The weighted-average expected long-term return on plan assets used to determine net periodic benefit cost for the year ended
December 31, 2012 is expected to be 7.75%.
Pension Assets
The assets of the qualified pension plans are held in a master trust in which the qualified pension plans are the only
participating plans (the “Master Trust”). The investment policy for the qualified pension plans is to maximize the long-term
rate of return on plan assets within a prudent level of risk and diversification while maintaining adequate funding levels. The
investment portfolio is a mix of equity and fixed-income securities with the objective of preserving asset values, diversifying
risk and achieving a target investment return. The pension plans’ Investment Committee regularly monitors investment
performance, investment allocation policies and the performance of individual investment managers of the Master Trust and
101