Time Warner Cable 2011 Annual Report Download - page 107
Download and view the complete annual report
Please find page 107 of the 2011 Time Warner Cable annual report below. You can navigate through the pages in the report by either clicking on the pages listed below, or by using the keyword search tool below to find specific information within the annual report.-
 1
1 -
2
-
3
-
4
-
5
-
6
-
7
-
8
-
9
-
10
-
11
-
12
-
13
-
14
-
15
-
16
-
17
-
18
-
19
-
20
-
21
-
22
-
23
-
24
-
25
-
26
-
27
-
28
-
29
-
30
-
31
-
32
-
33
-
34
-
35
-
36
-
37
-
38
-
39
-
40
-
41
-
42
-
43
-
44
-
45
-
46
-
47
-
48
-
49
-
50
-
51
-
52
-
53
-
54
-
55
-
56
-
57
-
58
-
59
-
60
-
61
-
62
-
63
-
64
-
65
-
66
-
67
-
68
-
69
-
70
-
71
-
72
-
73
-
74
-
75
-
76
-
77
-
78
-
79
-
80
-
81
-
82
-
83
-
84
-
85
-
86
-
87
-
88
-
89
-
90
-
91
-
92
-
93
-
94
-
95
-
96
-
 97
97 -
 98
98 -
 99
99 -
 100
100 -
 101
101 -
 102
102 -
 103
103 -
 104
104 -
 105
105 -
 106
106 -
 107
107 -
 108
108 -
 109
109 -
 110
110 -
 111
111 -
 112
112 -
 113
113 -
 114
114 -
 115
115 -
 116
116 -
 117
117 -
118
-
119
-
120
-
121
-
122
-
123
-
124
-
125
-
126
-
127
-
128
-
129
-
130
-
131
-
132
-
133
-
134
-
135
-
136
-
137
-
138
-
139
-
140
-
141
-
142
-
143
-
144
-
145
-
146
-
147
-
148
 |
 |

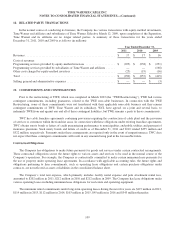
TIME WARNER CABLE INC.
NOTES TO CONSOLIDATED FINANCIAL STATEMENTS—(Continued)
During February 2012, TWC granted approximately 1.4 million RSUs under the 2011 Plan, of which 194,000 were
PBUs.
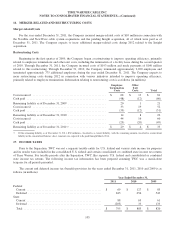
Stock Options
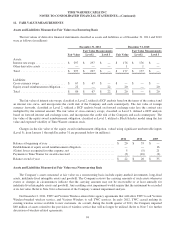
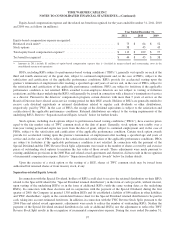
The table below presents the assumptions used to value stock options at their grant date for the years ended
December 31, 2011, 2010 and 2009 and reflects the weighted average of all awards granted within each year:
Year Ended December 31,
2011 2010 2009
Expected volatility ................................................. 31.19% 31.39% 34.31%
Expected term to exercise from grant date (in years) ...................... 6.42 6.73 6.04
Risk-free rate ..................................................... 2.80% 3.06% 2.57%
Expected dividend yield ............................................ 2.66% 3.54% 0.00%
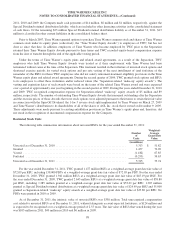
The following table summarizes information about stock options that were outstanding as of December 31, 2011:
Number
of Options
Weighted-
Average
Exercise
Price
Weighted-
Average
Remaining
Contractual
Term
Aggregate
Intrinsic
Value
(in millions) (in years) (in millions)
Outstanding as of December 31, 2010 ........................ 11.485 $ 36.03
Granted ............................................... 2.240 72.12
Exercised .............................................. (3.179) 35.86
Forfeited or expired ...................................... (0.405) 42.47
Outstanding as of December 31, 2011 ........................ 10.141 43.79 7.43 $ 219
Exercisable as of December 31, 2011 ........................ 2.432 38.43 6.02 61
Expected to vest as of December 31, 2011 .................... 7.513 45.25 7.86 155
For the year ended December 31, 2011, TWC granted 2.240 million stock options at a weighted-average grant date fair
value of $18.95 per option, including 262,000 PBOs at a weighted-average grant date fair value of $19.08 per PBO. For the
year ended December 31, 2010, TWC granted 3.803 million stock options at a weighted-average grant date fair value of
$10.95 per option. For the year ended December 31, 2009, TWC granted 6.345 million stock options at a weighted-average
grant date fair value of $9.69 per option, including 5.140 million stock options granted at a weighted-average grant date fair
value of $9.46 per option and 1.205 million stock options granted as Separation-related “make-up” equity awards at a
weighted-average grant date fair value of $10.64 per option. No PBOs were granted in 2010 or 2009.
The total intrinsic value of stock options exercised during the year ended December 31, 2011, 2010 and 2009 was $113
million, $69 million and $1 million, respectively. Cash received from stock options exercised during the year ended
December 31, 2011, 2010 and 2009 was $114 million, $122 million and $4 million, respectively, and tax benefits realized
from these exercises of stock options was $45 million, $28 million and $1 million, respectively. Total unrecognized
compensation cost related to unvested stock options as of December 31, 2011, without taking into account expected
forfeitures, is $49 million and is expected to be recognized over a weighted-average period of 2.40 years.
During February 2012, TWC granted options to purchase approximately 3.0 million shares of TWC common stock
under the 2011 Plan, of which 372,000 were PBOs.
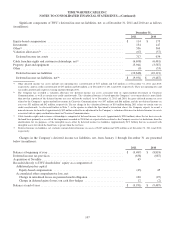
15. EMPLOYEE BENEFIT PLANS
Pension Plans
TWC sponsors two qualified noncontributory defined benefit pension plans – Time Warner Cable Pension Plan (the
“TWC Pension Plan”) and Time Warner Cable Union Pension Plan (the “Union Pension Plan” and, together with the TWC
Pension Plan, the “qualified pension plans”) – that together provide pension benefits to a majority of the Company’s
employees. TWC also provides a nonqualified noncontributory defined benefit pension plan for certain employees (the
99