Time Warner Cable 2011 Annual Report Download - page 135
Download and view the complete annual report
Please find page 135 of the 2011 Time Warner Cable annual report below. You can navigate through the pages in the report by either clicking on the pages listed below, or by using the keyword search tool below to find specific information within the annual report.-
 1
1 -
2
-
3
-
4
-
5
-
6
-
7
-
8
-
9
-
10
-
11
-
12
-
13
-
14
-
15
-
16
-
17
-
18
-
19
-
20
-
21
-
22
-
23
-
24
-
25
-
26
-
27
-
28
-
29
-
30
-
31
-
32
-
33
-
34
-
35
-
36
-
37
-
38
-
39
-
40
-
41
-
42
-
43
-
44
-
45
-
46
-
47
-
48
-
49
-
50
-
51
-
52
-
53
-
54
-
55
-
56
-
57
-
58
-
59
-
60
-
61
-
62
-
63
-
64
-
65
-
66
-
67
-
68
-
69
-
70
-
71
-
72
-
73
-
74
-
75
-
76
-
77
-
78
-
79
-
80
-
81
-
82
-
83
-
84
-
85
-
86
-
87
-
88
-
89
-
90
-
91
-
92
-
93
-
94
-
95
-
96
-
97
-
98
-
99
-
100
-
101
-
102
-
103
-
104
-
105
-
106
-
107
-
108
-
109
-
110
-
111
-
112
-
113
-
114
-
115
-
116
-
117
-
118
-
119
-
120
-
121
-
122
-
123
-
124
-
 125
125 -
 126
126 -
 127
127 -
 128
128 -
 129
129 -
 130
130 -
 131
131 -
 132
132 -
 133
133 -
 134
134 -
 135
135 -
 136
136 -
 137
137 -
 138
138 -
 139
139 -
 140
140 -
 141
141 -
 142
142 -
 143
143 -
 144
144 -
 145
145 -
146
-
147
-
148
 |
 |

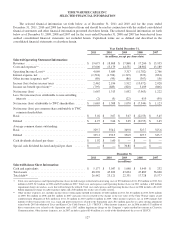
TIME WARNER CABLE INC.
SELECTED FINANCIAL INFORMATION
The selected financial information set forth below as of December 31, 2011 and 2010 and for the years ended
December 31, 2011, 2010 and 2009 has been derived from and should be read in conjunction with the audited consolidated
financial statements and other financial information presented elsewhere herein. The selected financial information set forth
below as of December 31, 2009, 2008 and 2007 and for the years ended December 31, 2008 and 2007 has been derived from
audited consolidated financial statements not included herein. Capitalized terms are as defined and described in the
consolidated financial statements or elsewhere herein.
Year Ended December 31,
2011 2010 2009 2008 2007
(in millions, except per share data)
Selected Operating Statement Information:
Revenues ........................................ $ 19,675 $ 18,868 $ 17,868 $ 17,200 $ 15,955
Costs and expenses(a) ............................... 15,606 15,179 14,551 28,982 13,189
Operating Income (Loss)(a) .......................... 4,069 3,689 3,317 (11,782) 2,766
Interest expense, net ............................... (1,518) (1,394) (1,319) (923) (894)
Other income (expense), net(b) ........................ (89) (99) (86) (367) 156
Income (loss) before income taxes .................... 2,462 2,196 1,912 (13,072) 2,028
Income tax benefit (provision)(c) ...................... (795) (883) (820) 5,109 (806)
Net income (loss) ................................. 1,667 1,313 1,092 (7,963) 1,222
Less: Net (income) loss attributable to noncontrolling
interests ....................................... (2) (5) (22) 619 (99)
Net income (loss) attributable to TWC shareholders ...... $ 1,665 $ 1,308 $ 1,070 $ (7,344) $ 1,123
Net income (loss) per common share attributable to TWC
common shareholders:
Basic ........................................... $ 5.02 $ 3.67 $ 3.07 $ (22.55) $ 3.45
Diluted ......................................... $ 4.97 $ 3.64 $ 3.05 $ (22.55) $ 3.45
Average common shares outstanding:
Basic ........................................... 329.7 354.2 349.0 325.7 325.6
Diluted ......................................... 335.3 359.5 350.9 325.7 325.7
Cash dividends declared per share .................... $ 1.92 $ 1.60 $ — $ — $ —
Special cash dividend declared and paid per share ....... $ — $ — $ 30.81 $ — $ —
December 31,
2011 2010 2009 2008 2007
(in millions)
Selected Balance Sheet Information:
Cash and equivalents .............................. $ 5,177 $ 3,047 $ 1,048 $ 5,449 $ 232
Total assets ...................................... 48,276 45,822 43,694 47,889 56,600
Total debt(d) ...................................... 26,442 23,121 22,331 17,728 13,577
(a) Total costs and expenses and Operating Income (Loss) include merger-related and restructuring costs of $70 million in 2011, $52 million in 2010, $81
million in 2009, $15 million in 2008 and $23 million in 2007. Total costs and expenses and Operating Income (Loss) in 2011 includes a $60 million
impairment charge on wireless assets that will no longer be utilized. Total costs and expenses and Operating Income (Loss) in 2008 includes a $14.822
billion impairment charge on cable franchise rights and a $58 million loss on the sale of cable systems.
(b) Other income (expense), net, includes income (losses) from equity-method investments of $(88) million in 2011, $(110) million in 2010, $(49) million
in 2009, $16 million in 2008 and $11 million in 2007 and gains (losses) related to the change in the fair value of the Time Warner equity award
reimbursement obligation of $(5) million in 2011, $5 million in 2010 and $(21) million in 2009. Other income (expense), net, in 2009 includes $28
million of direct transaction costs (e.g., legal and professional fees) related to the Separation and a $12 million gain due to a post-closing adjustment
related to the 2007 dissolution of Texas and Kansas City Cable Partners, L.P. (“TKCCP”). Other income (expense), net, in 2008 includes $17 million of
direct transaction costs related to the Separation and a $367 million impairment charge on the Company’s equity-method investment in Clearwire
Communications. Other income (expense), net, in 2007 includes a gain of $146 million as a result of the distribution of the assets of TKCCP.
127