Time Warner Cable 2011 Annual Report Download - page 66
Download and view the complete annual report
Please find page 66 of the 2011 Time Warner Cable annual report below. You can navigate through the pages in the report by either clicking on the pages listed below, or by using the keyword search tool below to find specific information within the annual report.-
 1
1 -
2
-
3
-
4
-
5
-
6
-
7
-
8
-
9
-
10
-
11
-
12
-
13
-
14
-
15
-
16
-
17
-
18
-
19
-
20
-
21
-
22
-
23
-
24
-
25
-
26
-
27
-
28
-
29
-
30
-
31
-
32
-
33
-
34
-
35
-
36
-
37
-
38
-
39
-
40
-
41
-
42
-
43
-
44
-
45
-
46
-
47
-
48
-
49
-
50
-
51
-
52
-
53
-
54
-
55
-
 56
56 -
 57
57 -
 58
58 -
 59
59 -
 60
60 -
 61
61 -
 62
62 -
 63
63 -
 64
64 -
 65
65 -
 66
66 -
 67
67 -
 68
68 -
 69
69 -
 70
70 -
 71
71 -
 72
72 -
 73
73 -
 74
74 -
 75
75 -
 76
76 -
77
-
78
-
79
-
80
-
81
-
82
-
83
-
84
-
85
-
86
-
87
-
88
-
89
-
90
-
91
-
92
-
93
-
94
-
95
-
96
-
97
-
98
-
99
-
100
-
101
-
102
-
103
-
104
-
105
-
106
-
107
-
108
-
109
-
110
-
111
-
112
-
113
-
114
-
115
-
116
-
117
-
118
-
119
-
120
-
121
-
122
-
123
-
124
-
125
-
126
-
127
-
128
-
129
-
130
-
131
-
132
-
133
-
134
-
135
-
136
-
137
-
138
-
139
-
140
-
141
-
142
-
143
-
144
-
145
-
146
-
147
-
148
 |
 |

TIME WARNER CABLE INC.
MANAGEMENT’S DISCUSSION AND ANALYSIS OF RESULTS
OF OPERATIONS AND FINANCIAL CONDITION—(Continued)
Operating Activities
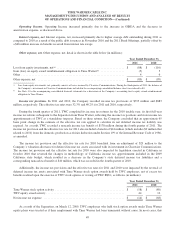
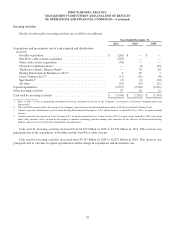
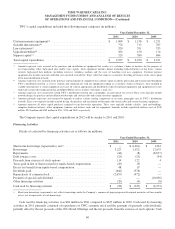
Details of cash provided by operating activities are as follows (in millions):
Year Ended December 31,
2011 2010 2009
OIBDA ......................................................... $ 7,096 $ 6,818 $ 6,402
Noncash equity-based compensation .................................. 112 109 97
Net interest payments(a) ............................................. (1,434) (1,359) (1,221)
Pension plan contributions .......................................... (405) (104) (170)
Net income tax refunds (payments)(b) ................................... 162 (388) (37)
Net merger-related and restructuring accruals (payments) .................. 11 (1) 14
All other, net, including working capital changes ......................... 146 143 94
Cash provided by operating activities .................................. $ 5,688 $ 5,218 $ 5,179
(a) Amounts include interest income received (including amounts received under interest rate swap contracts) of $161 million, $99 million and $13 million
in 2011, 2010 and 2009, respectively.
(b) Amounts include income tax refunds received of $273 million, $93 million and $53 million in 2011, 2010 and 2009, respectively.
Cash provided by operating activities increased from $5.218 billion in 2010 to $5.688 billion in 2011. This increase was
primarily related to changes in income tax refunds and payments (discussed below) and an increase in OIBDA, partially
offset by increases in pension plan contributions and net interest payments.
On September 27, 2010, the Small Business Jobs Act was enacted, which provided for a bonus depreciation deduction
of 50% of the cost of the Company’s qualified capital expenditures retroactive to the beginning of 2010. Additionally, on
December 17, 2010, the Tax Relief, Unemployment Insurance Reauthorization and Job Creation Act of 2010 was enacted,
which provides for a bonus depreciation deduction of 100% of the cost of the Company’s qualified capital expenditures from
September 8, 2010 through December 31, 2011. As a result of these Acts, the Company received an income tax refund of
$270 million in the first quarter of 2011, which, along with the benefit of 100% bonus depreciation through December 31,
2011 and increased pension plan contributions in the fourth quarter of 2011 (which are an income tax deduction), resulted in
net income tax refunds of $162 million for the year ended December 31, 2011. The Company expects net income tax
payments to increase significantly in 2012 as a result of the decline in the bonus depreciation deduction to 50% of the cost of
the Company’s 2012 qualified capital expenditures and the continued reversal of bonus depreciation benefits recorded in
prior years, as well as income tax payments on the pending SpectrumCo sale gain.
The Company contributed $405 million to its qualified and nonqualified noncontributory defined benefit pension plans
(the “pension plans”) during 2011 and may make discretionary cash contributions to the pension plans in 2012. As of
December 31, 2011, the pension plans were underfunded by $50 million. See Note 15 to the accompanying consolidated
financial statements for additional discussion of the pension plans.
Net interest payments for 2011 increased primarily as a result of interest payments related to the public debt issuances in
December 2009 and November 2010, partially offset by an increase in amounts received under interest rate swaps. The
Company expects that its net interest payments will increase in 2012 compared to 2011 primarily as a result of interest
payments related to the 2011 Bond Offerings.
Cash provided by operating activities increased from $5.179 billion in 2009 to $5.218 billion in 2010. This increase was
primarily related to an increase in OIBDA and decreases in pension plan contributions and working capital requirements,
largely offset by increases in net income tax and interest payments.
58