Time Warner Cable 2011 Annual Report Download - page 112
Download and view the complete annual report
Please find page 112 of the 2011 Time Warner Cable annual report below. You can navigate through the pages in the report by either clicking on the pages listed below, or by using the keyword search tool below to find specific information within the annual report.-
 1
1 -
2
-
3
-
4
-
5
-
6
-
7
-
8
-
9
-
10
-
11
-
12
-
13
-
14
-
15
-
16
-
17
-
18
-
19
-
20
-
21
-
22
-
23
-
24
-
25
-
26
-
27
-
28
-
29
-
30
-
31
-
32
-
33
-
34
-
35
-
36
-
37
-
38
-
39
-
40
-
41
-
42
-
43
-
44
-
45
-
46
-
47
-
48
-
49
-
50
-
51
-
52
-
53
-
54
-
55
-
56
-
57
-
58
-
59
-
60
-
61
-
62
-
63
-
64
-
65
-
66
-
67
-
68
-
69
-
70
-
71
-
72
-
73
-
74
-
75
-
76
-
77
-
78
-
79
-
80
-
81
-
82
-
83
-
84
-
85
-
86
-
87
-
88
-
89
-
90
-
91
-
92
-
93
-
94
-
95
-
96
-
97
-
98
-
99
-
100
-
101
-
 102
102 -
 103
103 -
 104
104 -
 105
105 -
 106
106 -
 107
107 -
 108
108 -
 109
109 -
 110
110 -
 111
111 -
 112
112 -
 113
113 -
 114
114 -
 115
115 -
 116
116 -
 117
117 -
 118
118 -
 119
119 -
 120
120 -
 121
121 -
 122
122 -
123
-
124
-
125
-
126
-
127
-
128
-
129
-
130
-
131
-
132
-
133
-
134
-
135
-
136
-
137
-
138
-
139
-
140
-
141
-
142
-
143
-
144
-
145
-
146
-
147
-
148
 |
 |

TIME WARNER CABLE INC.
NOTES TO CONSOLIDATED FINANCIAL STATEMENTS—(Continued)
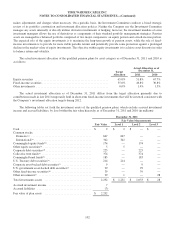
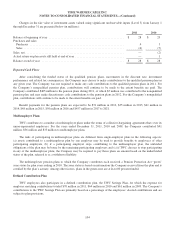
Changes in the fair value of investment assets valued using significant unobservable inputs (Level 3) from January 1
through December 31 are presented below (in millions):
2011 2010
Balance at beginning of year ................................................... $ 28 $ 29
Purchases and sales:
Purchases ................................................................ 4 3
Sales .................................................................... (4) (5)
Sales, net ................................................................... — (2)
Actual return on plan assets still held at end of year ................................. — 1
Balance at end of year ........................................................ $ 28 $ 28
Expected Cash Flows
After considering the funded status of the qualified pension plans, movements in the discount rate, investment
performance and related tax consequences, the Company may choose to make contributions to the qualified pension plans in
any given year. The Company was not required to make any cash contributions to the qualified pension plans in 2011. For
the Company’s nonqualified pension plan, contributions will continue to be made to the extent benefits are paid. The
Company contributed $405 million to the pension plans during 2011, of which $5 million was contributed to the nonqualified
pension plan, and may make discretionary cash contributions to the pension plans in 2012. For the Company’s nonqualified
plan, contributions will continue to be made to the extent benefits are paid.
Benefit payments for the pension plans are expected to be $31 million in 2012, $35 million in 2013, $41 million in
2014, $48 million in 2015, $56 million in 2016 and $457 million in 2017 to 2021.
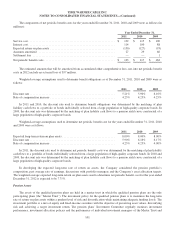
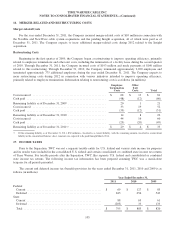
Multiemployer Plans
TWC contributes to a number of multiemployer plans under the terms of collective-bargaining agreements that cover its
union-represented employees. For the years ended December 31, 2011, 2010 and 2009, the Company contributed $41
million, $36 million and $33 million to multiemployer plans.
The risks of participating in multiemployer plans are different from single-employer plans in the following aspects:
(a) assets contributed to a multiemployer plan by one employer may be used to provide benefits to employees of other
participating employers, (b) if a participating employer stops contributing to the multiemployer plan, the unfunded
obligations of the plan may be borne by the remaining participating employers and (c) if TWC chooses to stop participating
in any of the multiemployer plans, the Company may be required to pay those plans an amount based on the underfunded
status of the plan, referred to as a withdrawal liability.
The multiemployer pension plans to which the Company contributes each received a Pension Protection Act “green”
zone status for plan years ending in 2010. The zone status is based on information the Company received from the plan and is
certified by the plan’s actuary. Among other factors, plans in the green zone are at least 80 percent funded.
Defined Contribution Plan
TWC employees also participate in a defined contribution plan, the TWC Savings Plan, for which the expense for
employer matching contributions totaled $70 million in 2011, $64 million in 2010 and $61 million in 2009. The Company’s
contributions to the TWC Savings Plan are primarily based on a percentage of the employees’ elected contributions and are
subject to plan provisions.
104