Time Warner Cable 2011 Annual Report Download - page 69
Download and view the complete annual report
Please find page 69 of the 2011 Time Warner Cable annual report below. You can navigate through the pages in the report by either clicking on the pages listed below, or by using the keyword search tool below to find specific information within the annual report.-
 1
1 -
2
-
3
-
4
-
5
-
6
-
7
-
8
-
9
-
10
-
11
-
12
-
13
-
14
-
15
-
16
-
17
-
18
-
19
-
20
-
21
-
22
-
23
-
24
-
25
-
26
-
27
-
28
-
29
-
30
-
31
-
32
-
33
-
34
-
35
-
36
-
37
-
38
-
39
-
40
-
41
-
42
-
43
-
44
-
45
-
46
-
47
-
48
-
49
-
50
-
51
-
52
-
53
-
54
-
55
-
56
-
57
-
58
-
 59
59 -
 60
60 -
 61
61 -
 62
62 -
 63
63 -
 64
64 -
 65
65 -
 66
66 -
 67
67 -
 68
68 -
 69
69 -
 70
70 -
 71
71 -
 72
72 -
 73
73 -
 74
74 -
 75
75 -
 76
76 -
 77
77 -
 78
78 -
 79
79 -
80
-
81
-
82
-
83
-
84
-
85
-
86
-
87
-
88
-
89
-
90
-
91
-
92
-
93
-
94
-
95
-
96
-
97
-
98
-
99
-
100
-
101
-
102
-
103
-
104
-
105
-
106
-
107
-
108
-
109
-
110
-
111
-
112
-
113
-
114
-
115
-
116
-
117
-
118
-
119
-
120
-
121
-
122
-
123
-
124
-
125
-
126
-
127
-
128
-
129
-
130
-
131
-
132
-
133
-
134
-
135
-
136
-
137
-
138
-
139
-
140
-
141
-
142
-
143
-
144
-
145
-
146
-
147
-
148
 |
 |

TIME WARNER CABLE INC.
MANAGEMENT’S DISCUSSION AND ANALYSIS OF RESULTS
OF OPERATIONS AND FINANCIAL CONDITION—(Continued)
used by financing activities in 2010 primarily included net repayments under the Company’s commercial paper program, the
payment of quarterly cash dividends and repurchases of TWC common stock, partially offset by the net proceeds of the
public debt issuance in November 2010 and the net proceeds from the exercise of stock options.
Cash used by financing activities was $347 million in 2010 compared to $6.273 billion in 2009. Cash used by financing
activities in 2010 primarily included net repayments under the Company’s commercial paper program, the payment of
quarterly cash dividends and repurchases of TWC common stock, partially offset by the net proceeds of the public debt
issuance in November 2010 and the net proceeds from the exercise of stock options. Cash used by financing activities in
2009 primarily included the payment of the special cash dividend in connection with the Separation, partially offset by the
net proceeds of the public debt issuances in March, June and December 2009 (after repayment of other debt).
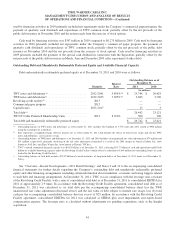
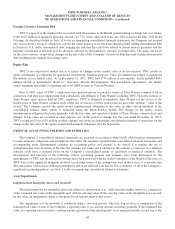
Outstanding Debt and Mandatorily Redeemable Preferred Equity and Available Financial Capacity
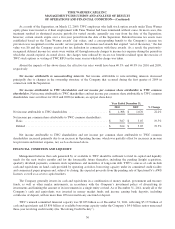
Debt and mandatorily redeemable preferred equity as of December 31, 2011 and 2010 were as follows:
Maturity
Interest
Rate
Outstanding Balance as of
December 31,
2011 2010
(in millions)
TWC notes and debentures(a) .......................... 2012-2041 5.859%(b) $ 23,744 $ 20,418
TWE notes and debentures(c) .......................... 2012-2033 7.625%(b) 2,683 2,700
Revolving credit facility(d) ............................ 2013 — —
Commercial paper program .......................... 2013 — —
Capital leases ...................................... 2013-2017 15 3
Total debt(e) ....................................... 26,442 23,121
TW NY Cable Preferred Membership Units .............. 2013 8.210% 300 300
Total debt and mandatorily redeemable preferred equity .... $ 26,742 $ 23,421
(a) Outstanding balance of TWC notes and debentures as of December 31, 2011 includes £623 million of 5.75% notes due 2031 valued at $968 million
using the exchange rate at that date.
(b) Rate represents a weighted-average effective interest rate as of December 31, 2011 and includes the effects of interest rate swaps and, for the TWC
notes and debentures, cross-currency swaps.
(c) Outstanding balance of TWE notes and debentures as of December 31, 2011 and 2010 includes an unamortized fair value adjustment of $79 million and
$91 million, respectively, primarily consisting of the fair value adjustment recognized as a result of the 2001 merger of America Online, Inc. (now
known as AOL Inc.) and Time Warner Inc. (now known as Historic TW Inc.).
(d) TWC’s unused committed financial capacity was $9.033 billion as of December 31, 2011, reflecting $5.177 billion of cash and equivalents and $3.856
billion of available borrowing capacity under the Revolving Credit Facility (which reflects a reduction of $144 million for outstanding letters of credit
backed by the Revolving Credit Facility).
(e) Outstanding balance of total debt includes $2.122 billion of current maturities of long-term debt as of December 31, 2011 (none as of December 31,
2010).
See “Overview—Recent Developments—2011 Bond Offerings” and Notes 9 and 10 to the accompanying consolidated
financial statements for further details regarding the Company’s outstanding debt and mandatorily redeemable preferred
equity and other financing arrangements, including certain information about maturities, covenants and rating triggers related
to such debt and financing arrangements. At December 31, 2011, TWC was in compliance with the leverage ratio covenant
of the Revolving Credit Facility, with a ratio of consolidated total debt as of December 31, 2011 to consolidated EBITDA for
2011 of approximately 2.9 times. In accordance with the Revolving Credit Facility agreement, consolidated total debt as of
December 31, 2011 was calculated as (a) total debt per the accompanying consolidated balance sheet less the TWE
unamortized fair value adjustment (discussed above) and the fair value of debt subject to interest rate swaps, less (b) total
cash per the accompanying consolidated balance sheet in excess of $25 million. In accordance with the Revolving Credit
Facility agreement, consolidated EBITDA for 2011 was calculated as OIBDA plus asset impairments and equity-based
compensation expense. The leverage ratio is calculated without adjustments for pending acquisitions, such as the Insight
acquisition.
61