Time Warner Cable 2011 Annual Report Download - page 53
Download and view the complete annual report
Please find page 53 of the 2011 Time Warner Cable annual report below. You can navigate through the pages in the report by either clicking on the pages listed below, or by using the keyword search tool below to find specific information within the annual report.-
 1
1 -
2
-
3
-
4
-
5
-
6
-
7
-
8
-
9
-
10
-
11
-
12
-
13
-
14
-
15
-
16
-
17
-
18
-
19
-
20
-
21
-
22
-
23
-
24
-
25
-
26
-
27
-
28
-
29
-
30
-
31
-
32
-
33
-
34
-
35
-
36
-
37
-
38
-
39
-
40
-
41
-
42
-
 43
43 -
 44
44 -
 45
45 -
 46
46 -
 47
47 -
 48
48 -
 49
49 -
 50
50 -
 51
51 -
 52
52 -
 53
53 -
 54
54 -
 55
55 -
 56
56 -
 57
57 -
 58
58 -
 59
59 -
 60
60 -
 61
61 -
 62
62 -
 63
63 -
64
-
65
-
66
-
67
-
68
-
69
-
70
-
71
-
72
-
73
-
74
-
75
-
76
-
77
-
78
-
79
-
80
-
81
-
82
-
83
-
84
-
85
-
86
-
87
-
88
-
89
-
90
-
91
-
92
-
93
-
94
-
95
-
96
-
97
-
98
-
99
-
100
-
101
-
102
-
103
-
104
-
105
-
106
-
107
-
108
-
109
-
110
-
111
-
112
-
113
-
114
-
115
-
116
-
117
-
118
-
119
-
120
-
121
-
122
-
123
-
124
-
125
-
126
-
127
-
128
-
129
-
130
-
131
-
132
-
133
-
134
-
135
-
136
-
137
-
138
-
139
-
140
-
141
-
142
-
143
-
144
-
145
-
146
-
147
-
148
 |
 |

TIME WARNER CABLE INC.
MANAGEMENT’S DISCUSSION AND ANALYSIS OF RESULTS
OF OPERATIONS AND FINANCIAL CONDITION—(Continued)
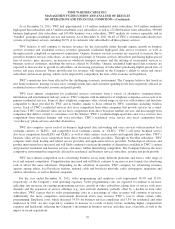
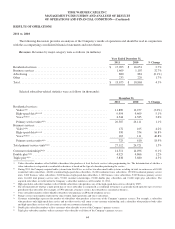
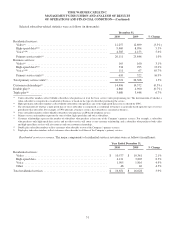
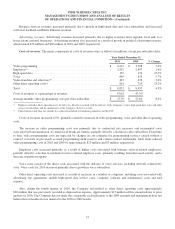
Residential services revenues. The major components of residential services revenues were as follows (in millions):
Year Ended December 31,
2011 2010 % Change
Residential services:
Video ........................................................ $ 10,589 $ 10,577 0.1%
High-speed data ................................................ 4,476 4,121 8.6%
Voice ........................................................ 1,979 1,905 3.9%
Other ........................................................ 49 48 2.1%
Total residential services ........................................... $ 17,093 $ 16,651 2.7%
Average monthly revenues per unit were as follows:
Year Ended December 31,
2011 2010 % Change
Residential services:
Video(a) ...................................................... $ 73.18 $ 70.46 3.9%
High-speed data(b) .............................................. 38.32 37.00 3.6%
Voice(c) ....................................................... 36.89 37.08 (0.5%)
Primary service units(d) .......................................... 54.30 53.24 2.0%
(a) Average monthly residential video revenues per unit represents residential video revenues divided by the corresponding average residential video
subscribers for the period.
(b) Average monthly residential high-speed data revenues per unit represents residential high-speed data revenues divided by the corresponding average
residential high-speed data subscribers for the period.
(c) Average monthly residential voice revenues per unit represents residential voice revenues divided by the corresponding average residential voice
subscribers for the period.
(d) Average monthly residential revenues per residential primary service unit represents residential services revenues divided by the corresponding average
residential primary service units for the period.
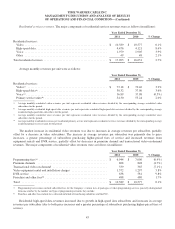
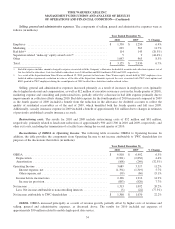
The modest increase in residential video revenues was due to increases in average revenues per subscriber, partially
offset by a decrease in video subscribers. The increase in average revenues per subscriber was primarily due to price
increases, a greater percentage of subscribers purchasing higher-priced tiers of service and increased revenues from
equipment rentals and DVR service, partially offset by decreases in premium channel and transactional video-on-demand
revenues. The major components of residential video revenues were as follows (in millions):
Year Ended December 31,
2011 2010 % Change
Programming tiers(a) .............................................. $ 6,944 $ 7,006 (0.9%)
Premium channels ............................................... 808 848 (4.7%)
Transactional video-on-demand ..................................... 339 365 (7.1%)
Video equipment rental and installation charges ........................ 1,372 1,297 5.8%
DVR service .................................................... 638 581 9.8%
Franchise and other fees(b) .......................................... 488 480 1.7%
Total .......................................................... $ 10,589 $ 10,577 0.1%
(a) Programming tier revenues include subscriber fees for the Company’s various tiers or packages of video programming services generally distinguished
from one another by the number and type of programming networks they include.
(b) Franchise and other fees include fees collected on behalf of franchising authorities and the FCC.
Residential high-speed data revenues increased due to growth in high-speed data subscribers and increases in average
revenues per subscriber (due to both price increases and a greater percentage of subscribers purchasing higher-priced tiers of
service).
45