Time Warner Cable 2011 Annual Report Download - page 54
Download and view the complete annual report
Please find page 54 of the 2011 Time Warner Cable annual report below. You can navigate through the pages in the report by either clicking on the pages listed below, or by using the keyword search tool below to find specific information within the annual report.-
 1
1 -
2
-
3
-
4
-
5
-
6
-
7
-
8
-
9
-
10
-
11
-
12
-
13
-
14
-
15
-
16
-
17
-
18
-
19
-
20
-
21
-
22
-
23
-
24
-
25
-
26
-
27
-
28
-
29
-
30
-
31
-
32
-
33
-
34
-
35
-
36
-
37
-
38
-
39
-
40
-
41
-
42
-
43
-
 44
44 -
 45
45 -
 46
46 -
 47
47 -
 48
48 -
 49
49 -
 50
50 -
 51
51 -
 52
52 -
 53
53 -
 54
54 -
 55
55 -
 56
56 -
 57
57 -
 58
58 -
 59
59 -
 60
60 -
 61
61 -
 62
62 -
 63
63 -
 64
64 -
65
-
66
-
67
-
68
-
69
-
70
-
71
-
72
-
73
-
74
-
75
-
76
-
77
-
78
-
79
-
80
-
81
-
82
-
83
-
84
-
85
-
86
-
87
-
88
-
89
-
90
-
91
-
92
-
93
-
94
-
95
-
96
-
97
-
98
-
99
-
100
-
101
-
102
-
103
-
104
-
105
-
106
-
107
-
108
-
109
-
110
-
111
-
112
-
113
-
114
-
115
-
116
-
117
-
118
-
119
-
120
-
121
-
122
-
123
-
124
-
125
-
126
-
127
-
128
-
129
-
130
-
131
-
132
-
133
-
134
-
135
-
136
-
137
-
138
-
139
-
140
-
141
-
142
-
143
-
144
-
145
-
146
-
147
-
148
 |
 |

TIME WARNER CABLE INC.
MANAGEMENT’S DISCUSSION AND ANALYSIS OF RESULTS
OF OPERATIONS AND FINANCIAL CONDITION—(Continued)
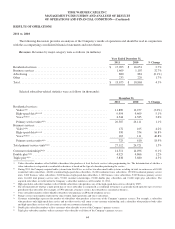
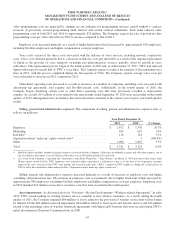
The increase in residential voice revenues was due to growth in voice subscribers, partially offset by a slight decrease in
average revenues per subscriber.
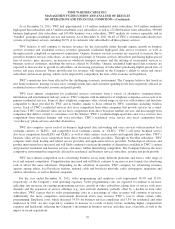
Business services revenues. The major components of business services revenues were as follows (in millions):
Year Ended December 31,
2011 2010 % Change
Business services:
Video ....................................................... $ 286 $ 266 7.5%
High-speed data ............................................... 727 614 18.4%
Voice ........................................................ 197 127 55.1%
Wholesale transport ............................................ 154 91 69.2%
Other(a) ....................................................... 105 9 NM
Total business services ............................................ $ 1,469 $ 1,107 32.7%
NM—Not meaningful.
(a) 2011 amounts primarily consist of revenues from NaviSite.
Business services revenues increased primarily due to growth in high-speed data and voice subscribers, a $56 million
increase in cell tower backhaul revenues and the acquisition of NaviSite in the second quarter of 2011. NaviSite’s revenues
from the date of acquisition (April 21, 2011) through December 31, 2011 were $94 million.
Advertising revenues. Advertising revenues were flat as $47 million of growth in lower margin revenues from
advertising inventory sold on behalf of other video distributors (“advertising rep agreements”) and an $11 million increase in
revenues primarily from regional and local businesses offset a $59 million decline in political advertising revenues. The
Company expects advertising revenues in 2012 to benefit from growth in political advertising revenues (primarily in the
second half of 2012), as well as growth in revenues from advertising rep agreements.
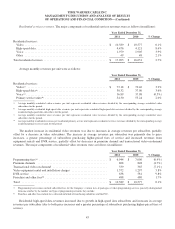
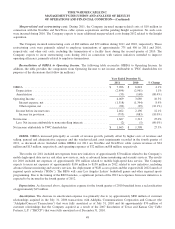
Costs of revenues. The major components of costs of revenues were as follows (in millions, except per subscriber data):
Year Ended December 31,
2011 2010 % Change
Video programming .............................................. $ 4,342 $ 4,213 3.1%
Employee(a) ..................................................... 2,621 2,532 3.5%
High-speed data ................................................. 170 152 11.8%
Voice .......................................................... 595 669 (11.1%)
Video franchise and other fees(b) ..................................... 500 493 1.4%
Other direct operating costs(a) ....................................... 910 814 11.8%
Total .......................................................... $ 9,138 $ 8,873 3.0%
Costs of revenues as a percentage of revenues .......................... 46.4% 47.0%
Average monthly video programming costs per video subscriber ........... $ 29.59 $ 27.70 6.8%
Average monthly voice costs per voice subscriber ...................... $ 10.76 $ 12.75 (15.6%)
(a) Employee and other direct operating costs include costs directly associated with the delivery of the Company’s video, high-speed data, voice and other
services to subscribers and the maintenance of the Company’s delivery systems.
(b) Video franchise and other fees include fees collected on behalf of franchising authorities and the FCC.
Costs of revenues increased 3.0% primarily related to increases in video programming, employee and other direct
operating costs, partially offset by a decrease in voice costs.
The increase in video programming costs was primarily due to contractual rate increases and increased costs associated
with retransmission of certain local broadcast stations, partially offset by a decline in video subscribers. From time to time,
46