Time Warner Cable 2011 Annual Report Download - page 137
Download and view the complete annual report
Please find page 137 of the 2011 Time Warner Cable annual report below. You can navigate through the pages in the report by either clicking on the pages listed below, or by using the keyword search tool below to find specific information within the annual report.-
 1
1 -
2
-
3
-
4
-
5
-
6
-
7
-
8
-
9
-
10
-
11
-
12
-
13
-
14
-
15
-
16
-
17
-
18
-
19
-
20
-
21
-
22
-
23
-
24
-
25
-
26
-
27
-
28
-
29
-
30
-
31
-
32
-
33
-
34
-
35
-
36
-
37
-
38
-
39
-
40
-
41
-
42
-
43
-
44
-
45
-
46
-
47
-
48
-
49
-
50
-
51
-
52
-
53
-
54
-
55
-
56
-
57
-
58
-
59
-
60
-
61
-
62
-
63
-
64
-
65
-
66
-
67
-
68
-
69
-
70
-
71
-
72
-
73
-
74
-
75
-
76
-
77
-
78
-
79
-
80
-
81
-
82
-
83
-
84
-
85
-
86
-
87
-
88
-
89
-
90
-
91
-
92
-
93
-
94
-
95
-
96
-
97
-
98
-
99
-
100
-
101
-
102
-
103
-
104
-
105
-
106
-
107
-
108
-
109
-
110
-
111
-
112
-
113
-
114
-
115
-
116
-
117
-
118
-
119
-
120
-
121
-
122
-
123
-
124
-
125
-
126
-
 127
127 -
 128
128 -
 129
129 -
 130
130 -
 131
131 -
 132
132 -
 133
133 -
 134
134 -
 135
135 -
 136
136 -
 137
137 -
 138
138 -
 139
139 -
 140
140 -
 141
141 -
 142
142 -
 143
143 -
 144
144 -
 145
145 -
 146
146 -
 147
147 -
148
 |
 |

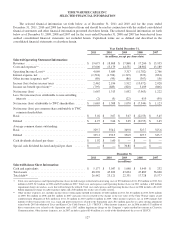
TIME WARNER CABLE INC.
QUARTERLY FINANCIAL INFORMATION
(Unaudited)
Quarter Ended
March 31, June 30, September 30, December 31,
(in millions, except per share data)
2011
Revenues ............................................... $ 4,827 $ 4,944 $ 4,911 $ 4,993
Operating Income ........................................ 975 1,063 1,002 1,029
Net income .............................................. 326 421 356 564
Net income attributable to TWC shareholders .................. 325 420 356 564
Net income per common share attributable to TWC common
shareholders:
Basic(a) ................................................ 0.94 1.25 1.09 1.76
Diluted(a) .............................................. 0.93 1.24 1.08 1.75
Common stock—high ..................................... 72.48 78.46 79.99 71.84
Common stock—low ...................................... 64.91 71.75 60.85 57.41
Cash dividends declared per share ............................ 0.48 0.48 0.48 0.48
2010
Revenues ............................................... $ 4,599 $ 4,734 $ 4,734 $ 4,801
Operating Income ........................................ 850 918 927 994
Net income .............................................. 215 342 363 393
Net income attributable to TWC shareholders .................. 214 342 360 392
Net income per common share attributable to TWC common
shareholders:
Basic(a) ................................................ 0.60 0.96 1.00 1.10
Diluted(a) .............................................. 0.60 0.95 1.00 1.09
Common stock—high ..................................... 53.45 57.37 59.07 66.11
Common stock—low ...................................... 41.33 48.93 50.96 54.66
Cash dividends declared per share ............................ 0.40 0.40 0.40 0.40
(a) Per common share amounts for the quarters and full years have each been calculated separately. Accordingly, quarterly amounts may not sum to the
annual amounts because of differences in the weighted-average common shares outstanding during each period.
129