Time Warner Cable 2011 Annual Report Download - page 110
Download and view the complete annual report
Please find page 110 of the 2011 Time Warner Cable annual report below. You can navigate through the pages in the report by either clicking on the pages listed below, or by using the keyword search tool below to find specific information within the annual report.-
 1
1 -
2
-
3
-
4
-
5
-
6
-
7
-
8
-
9
-
10
-
11
-
12
-
13
-
14
-
15
-
16
-
17
-
18
-
19
-
20
-
21
-
22
-
23
-
24
-
25
-
26
-
27
-
28
-
29
-
30
-
31
-
32
-
33
-
34
-
35
-
36
-
37
-
38
-
39
-
40
-
41
-
42
-
43
-
44
-
45
-
46
-
47
-
48
-
49
-
50
-
51
-
52
-
53
-
54
-
55
-
56
-
57
-
58
-
59
-
60
-
61
-
62
-
63
-
64
-
65
-
66
-
67
-
68
-
69
-
70
-
71
-
72
-
73
-
74
-
75
-
76
-
77
-
78
-
79
-
80
-
81
-
82
-
83
-
84
-
85
-
86
-
87
-
88
-
89
-
90
-
91
-
92
-
93
-
94
-
95
-
96
-
97
-
98
-
99
-
 100
100 -
 101
101 -
 102
102 -
 103
103 -
 104
104 -
 105
105 -
 106
106 -
 107
107 -
 108
108 -
 109
109 -
 110
110 -
 111
111 -
 112
112 -
 113
113 -
 114
114 -
 115
115 -
 116
116 -
 117
117 -
 118
118 -
 119
119 -
 120
120 -
121
-
122
-
123
-
124
-
125
-
126
-
127
-
128
-
129
-
130
-
131
-
132
-
133
-
134
-
135
-
136
-
137
-
138
-
139
-
140
-
141
-
142
-
143
-
144
-
145
-
146
-
147
-
148
 |
 |

TIME WARNER CABLE INC.
NOTES TO CONSOLIDATED FINANCIAL STATEMENTS—(Continued)
makes adjustments and changes when necessary. On a periodic basis, the Investment Committee conducts a broad strategic
review of its portfolio construction and investment allocation policies. Neither the Company nor the Investment Committee
manages any assets internally or directly utilizes derivative instruments or hedging; however, the investment mandate of some
investment managers allows the use of derivatives as components of their standard portfolio management strategies. Pension
assets are managed in a balanced portfolio comprised of two major components: an equity portion and a fixed-income portion.
The expected role of the equity investments is to maximize the long-term growth of pension assets, while the role of fixed-
income investments is to provide for more stable periodic returns and potentially provide some protection against a prolonged
decline in the market value of equity investments. The objective within equity investments is to achieve asset diversity in order
to balance return and volatility.
The actual investment allocation of the qualified pension plans by asset category as of December 31, 2011 and 2010 is
as follows:
Target
Allocation
Actual Allocation as of
December 31,
2011 2010
Equity securities .................................................. 65.0% 51.8% 67.7%
Fixed-income securities ............................................. 35.0% 46.8% 30.8%
Other investments ................................................. 0.0% 1.4% 1.5%
The actual investment allocation as of December 31, 2011 differs from the target allocation primarily due to
contributions made in late 2011 temporarily held in short-term fixed-income investments that will be invested consistent with
the Company’s investment allocation targets during 2012.
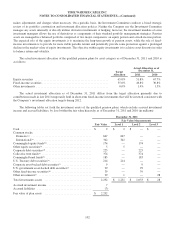
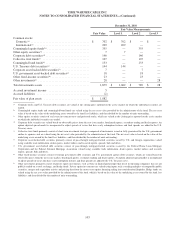
The following tables set forth the investment assets of the qualified pension plans, which exclude accrued investment
income and accrued liabilities, by level within the fair value hierarchy as of December 31, 2011 and 2010 (in millions):
December 31, 2011
Fair Value Measurements
Fair Value Level 1 Level 2 Level 3
Cash ................................................ $ 2 $ 2 $ — $ —
Common stocks:
Domestic(a) ......................................... 667 667 — —
International(a) ....................................... 342 342 — —
Commingled equity funds(b) .............................. 174 — 174 —
Other equity securities(c) ................................. 5 5 — —
Corporate debt securities(d) ............................... 225 — 225 —
Collective trust funds(e) .................................. 374 — 374 —
Commingled bond funds(b) ............................... 183 — 183 —
U.S. Treasury debt securities(a) ............................ 214 214 — —
Corporate asset-backed debt securities(f) .................... 9 — 9 —
U.S. government asset-backed debt securities(g) .............. 29 — 29 —
Other fixed-income securities(h) ........................... 39 — 39 —
Other investments(i) .................................... 29 1 — 28
Total investments assets ................................ 2,292 $ 1,231 $ 1,033 $ 28
Accrued investment income ............................. 7
Accrued liabilities ..................................... (7)
Fair value of plan assets ................................ $ 2,292
102