Time Warner Cable 2011 Annual Report Download - page 68
Download and view the complete annual report
Please find page 68 of the 2011 Time Warner Cable annual report below. You can navigate through the pages in the report by either clicking on the pages listed below, or by using the keyword search tool below to find specific information within the annual report.-
 1
1 -
2
-
3
-
4
-
5
-
6
-
7
-
8
-
9
-
10
-
11
-
12
-
13
-
14
-
15
-
16
-
17
-
18
-
19
-
20
-
21
-
22
-
23
-
24
-
25
-
26
-
27
-
28
-
29
-
30
-
31
-
32
-
33
-
34
-
35
-
36
-
37
-
38
-
39
-
40
-
41
-
42
-
43
-
44
-
45
-
46
-
47
-
48
-
49
-
50
-
51
-
52
-
53
-
54
-
55
-
56
-
57
-
 58
58 -
 59
59 -
 60
60 -
 61
61 -
 62
62 -
 63
63 -
 64
64 -
 65
65 -
 66
66 -
 67
67 -
 68
68 -
 69
69 -
 70
70 -
 71
71 -
 72
72 -
 73
73 -
 74
74 -
 75
75 -
 76
76 -
 77
77 -
 78
78 -
79
-
80
-
81
-
82
-
83
-
84
-
85
-
86
-
87
-
88
-
89
-
90
-
91
-
92
-
93
-
94
-
95
-
96
-
97
-
98
-
99
-
100
-
101
-
102
-
103
-
104
-
105
-
106
-
107
-
108
-
109
-
110
-
111
-
112
-
113
-
114
-
115
-
116
-
117
-
118
-
119
-
120
-
121
-
122
-
123
-
124
-
125
-
126
-
127
-
128
-
129
-
130
-
131
-
132
-
133
-
134
-
135
-
136
-
137
-
138
-
139
-
140
-
141
-
142
-
143
-
144
-
145
-
146
-
147
-
148
 |
 |

TIME WARNER CABLE INC.
MANAGEMENT’S DISCUSSION AND ANALYSIS OF RESULTS
OF OPERATIONS AND FINANCIAL CONDITION—(Continued)
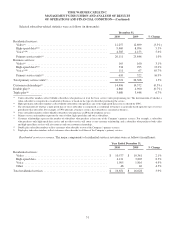
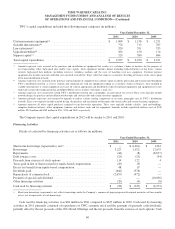
TWC’s capital expenditures included the following major categories (in millions):
Year Ended December 31,
2011 2010 2009
Customer premise equipment(a) ..................................... $ 1,008 $ 1,136 $ 1,251
Scalable infrastructure(b) .......................................... 774 713 787
Line extensions(c) ................................................ 320 351 335
Upgrades/rebuilds(d) .............................................. 106 150 174
Support capital(e) ................................................ 729 580 684
Total capital expenditures ........................................ $ 2,937 $ 2,930 $ 3,231
(a) Amounts represent costs incurred in the purchase and installation of equipment that resides at a customer’s home or business for the purpose of
receiving/sending video, high-speed data and/or voice signals. Such equipment includes digital (including high-definition) set-top boxes, remote
controls, high-speed data modems (including wireless), telephone modems and the costs of installing such new equipment. Customer premise
equipment also includes materials and labor costs incurred to install the “drop” cable that connects a customer’s dwelling or business to the closest point
of the main distribution network.
(b) Amounts represent costs incurred in the purchase and installation of equipment that controls signal reception, processing and transmission throughout
TWC’s distribution network, as well as controls and communicates with the equipment residing at a customer’s home or business. Also included in
scalable infrastructure is certain equipment necessary for content aggregation and distribution (video-on-demand equipment) and equipment necessary
to provide certain video, high-speed data and Digital Phone service features (voicemail, e-mail, etc.).
(c) Amounts represent costs incurred to extend TWC’s distribution network into a geographic area previously not served. These costs typically include
network design, the purchase and installation of fiber optic and coaxial cable and certain electronic equipment.
(d) Amounts primarily represent costs incurred to upgrade or replace certain existing components or an entire geographic area of TWC’s distribution
network. These costs typically include network design, the purchase and installation of fiber optic and coaxial cable and certain electronic equipment.
(e) Amounts represent all other capital purchases required to run day-to-day operations. These costs typically include vehicles, land and buildings,
computer hardware/software, office equipment, furniture and fixtures, tools and test equipment. Amounts include capitalized software costs of $339
million, $203 million and $202 million in 2011, 2010 and 2009, respectively.
The Company expects that capital expenditures in 2012 will be similar to 2011 and 2010.
Financing Activities
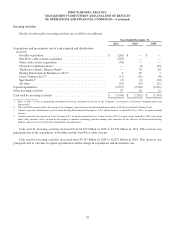
Details of cash used by financing activities are as follows (in millions):
Year Ended December 31,
2011 2010 2009
Short-term borrowings (repayments), net(a) ............................ $ — $(1,261) $ 1,261
Borrowings .................................................... 3,227 1,872 12,037
Repayments ................................................... (44) (8) (8,677)
Debt issuance costs .............................................. (25) (25) (34)
Proceeds from exercise of stock options ............................. 114 122 4
Taxes paid in lieu of shares issued for equity-based compensation ......... (29) (9) —
Excess tax benefit from equity-based compensation .................... 48 19 —
Dividends paid ................................................. (642) (576) —
Repurchases of common stock ..................................... (2,657) (472) —
Payment of special cash dividend .................................. — — (10,856)
Other financing activities ......................................... (20) (9) (8)
Cash used by financing activities ................................... $ (28) $ (347) $ (6,273)
(a) Short-term borrowings (repayments), net, reflects borrowings under the Company’s commercial paper program with original maturities of three months
or less, net of repayments of such borrowings.
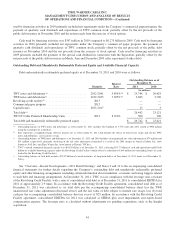
Cash used by financing activities was $28 million in 2011 compared to $347 million in 2010. Cash used by financing
activities in 2011 primarily consisted of repurchases of TWC common stock and the payment of quarterly cash dividends,
partially offset by the net proceeds of the 2011 Bond Offerings and the net proceeds from the exercise of stock options. Cash
60