Time Warner Cable 2011 Annual Report Download - page 131
Download and view the complete annual report
Please find page 131 of the 2011 Time Warner Cable annual report below. You can navigate through the pages in the report by either clicking on the pages listed below, or by using the keyword search tool below to find specific information within the annual report.-
 1
1 -
2
-
3
-
4
-
5
-
6
-
7
-
8
-
9
-
10
-
11
-
12
-
13
-
14
-
15
-
16
-
17
-
18
-
19
-
20
-
21
-
22
-
23
-
24
-
25
-
26
-
27
-
28
-
29
-
30
-
31
-
32
-
33
-
34
-
35
-
36
-
37
-
38
-
39
-
40
-
41
-
42
-
43
-
44
-
45
-
46
-
47
-
48
-
49
-
50
-
51
-
52
-
53
-
54
-
55
-
56
-
57
-
58
-
59
-
60
-
61
-
62
-
63
-
64
-
65
-
66
-
67
-
68
-
69
-
70
-
71
-
72
-
73
-
74
-
75
-
76
-
77
-
78
-
79
-
80
-
81
-
82
-
83
-
84
-
85
-
86
-
87
-
88
-
89
-
90
-
91
-
92
-
93
-
94
-
95
-
96
-
97
-
98
-
99
-
100
-
101
-
102
-
103
-
104
-
105
-
106
-
107
-
108
-
109
-
110
-
111
-
112
-
113
-
114
-
115
-
116
-
117
-
118
-
119
-
120
-
 121
121 -
 122
122 -
 123
123 -
 124
124 -
 125
125 -
 126
126 -
 127
127 -
 128
128 -
 129
129 -
 130
130 -
 131
131 -
 132
132 -
 133
133 -
 134
134 -
 135
135 -
 136
136 -
 137
137 -
 138
138 -
 139
139 -
 140
140 -
 141
141 -
142
-
143
-
144
-
145
-
146
-
147
-
148
 |
 |

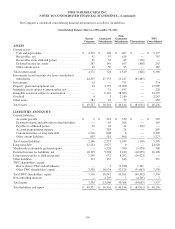
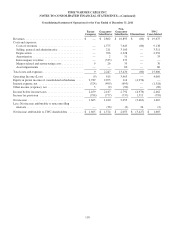
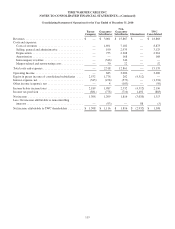
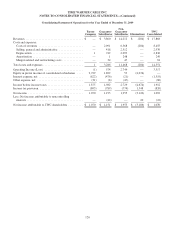
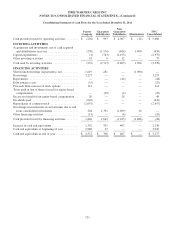
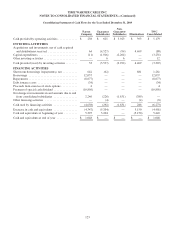
TIME WARNER CABLE INC.
NOTES TO CONSOLIDATED FINANCIAL STATEMENTS—(Continued)
Consolidating Statement of Cash Flows for the Year Ended December 31, 2009
Parent
Company
Guarantor
Subsidiaries
Non-
Guarantor
Subsidiaries Eliminations
TWC
Consolidated
Cash provided by operating activities ............. $ 238 $ 625 $ 3,923 $ 393 $ 5,179
INVESTING ACTIVITIES
Acquisitions and investments, net of cash acquired
and distributions received .................... 64 (4,527) (94) 4,469 (88)
Capital expenditures .......................... (11) (1,016) (2,204) — (3,231)
Other investing activities ....................... — 6 6 — 12
Cash provided (used) by investing activities ........ 53 (5,537) (2,292) 4,469 (3,307)
FINANCING ACTIVITIES
Short-term borrowings (repayments), net .......... 642 (62) — 681 1,261
Borrowings ................................. 12,037 — — — 12,037
Repayments ................................. (8,677) — — — (8,677)
Debt issuance costs ........................... (34) — — — (34)
Proceeds from exercise of stock options ........... 4 — — — 4
Payment of special cash dividend ................ (10,856) — — — (10,856)
Net change in investments in and amounts due to and
from consolidated subsidiaries ................ 2,246 (226) (1,631) (389) —
Other financing activities ...................... — (4) — (4) (8)
Cash used by financing activities ................ (4,638) (292) (1,631) 288 (6,273)
Decrease in cash and equivalents ................ (4,347) (5,204) — 5,150 (4,401)
Cash and equivalents at beginning of year ......... 5,395 5,204 — (5,150) 5,449
Cash and equivalents at end of year .............. $ 1,048 $ — $ — $ — $ 1,048
123