Time Warner Cable 2009 Annual Report Download - page 93
Download and view the complete annual report
Please find page 93 of the 2009 Time Warner Cable annual report below. You can navigate through the pages in the report by either clicking on the pages listed below, or by using the keyword search tool below to find specific information within the annual report.-
 1
1 -
2
-
3
-
4
-
5
-
6
-
7
-
8
-
9
-
10
-
11
-
12
-
13
-
14
-
15
-
16
-
17
-
18
-
19
-
20
-
21
-
22
-
23
-
24
-
25
-
26
-
27
-
28
-
29
-
30
-
31
-
32
-
33
-
34
-
35
-
36
-
37
-
38
-
39
-
40
-
41
-
42
-
43
-
44
-
45
-
46
-
47
-
48
-
49
-
50
-
51
-
52
-
53
-
54
-
55
-
56
-
57
-
58
-
59
-
60
-
61
-
62
-
63
-
64
-
65
-
66
-
67
-
68
-
69
-
70
-
71
-
72
-
73
-
74
-
75
-
76
-
77
-
78
-
79
-
80
-
81
-
82
-
 83
83 -
 84
84 -
 85
85 -
 86
86 -
 87
87 -
 88
88 -
 89
89 -
 90
90 -
 91
91 -
 92
92 -
 93
93 -
 94
94 -
 95
95 -
 96
96 -
 97
97 -
 98
98 -
 99
99 -
 100
100 -
 101
101 -
 102
102 -
 103
103 -
104
-
105
-
106
-
107
-
108
-
109
-
110
-
111
-
112
-
113
-
114
-
115
-
116
-
117
-
118
-
119
-
120
-
121
-
122
-
123
-
124
-
125
-
126
-
127
-
128
 |
 |

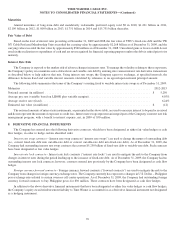
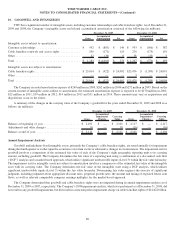
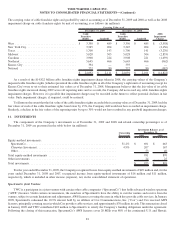
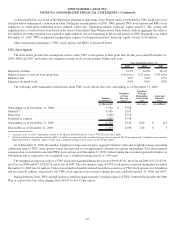
The carrying value of cable franchise rights and goodwill by unit of accounting as of December 31, 2009 and 2008 as well as the 2008
impairment charge on cable franchise rights by unit of accounting is as follows (in millions):
Cable
Franchise
Rights Goodwill
Cable
Franchise
Rights Goodwill
2008
Impairment
Charge
December 31, 2009 December 31, 2008
Carrying Value as of
West ...................................... $ 3,350 $ 489 $ 3,350 $ 485 $ (3,558)
New York City............................... 3,345 204 3,345 204 (2,156)
Texas...................................... 1,700 143 1,700 141 (3,270)
Midwest ................................... 5,028 505 5,028 504 (2,835)
Carolinas ................................... 3,908 224 3,908 221 (1,659)
Northeast ................................... 5,645 466 5,645 466 (962)
Kansas City ................................. 394 — 393 — —
National ................................... 722 80 722 80 (382)
$ 24,092 $ 2,111 $ 24,091 $ 2,101 $ (14,822)
As a result of the $14.822 billion cable franchise rights impairment charge taken in 2008, the carrying values of the Company’s
impaired cable franchise rights (which represented the cable franchise rights in all of the Company’s eight units of accounting except for
Kansas City) were re-set to their estimated fair values as of December 31, 2008. Management believes that the fair value of its cable
franchise rights increased during 2009 across all reporting units and as a result, the Company did not record any cable franchise rights
impairment charges. However, it is possible that impairment charges may be recorded in the future to reflect potential declines in fair
value. Such impairment charges, if required, could be material.
To illustrate the extent that the fair value of the cable franchise rights exceeded their carrying value as of December 31, 2009, had the
fair values of each of the cable franchise rights been lower by 15%, the Company still would not have recorded an impairment charge.
Similarly, a decline in the fair values of the reporting units by up to 30% would not have resulted in any goodwill impairment charges.
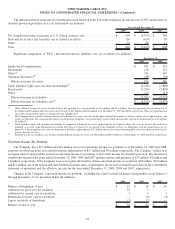
11. INVESTMENTS
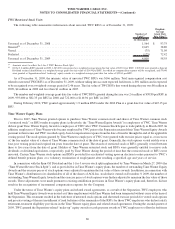
The components of the Company’s investments as of December 31, 2009 and 2008 and related ownership percentages as of
December 31, 2009 are presented in the table below (in millions):
Ownership
Percentage 2009 2008
Investment Balance as of
December 31,
Equity-method investments:
SpectrumCo. ....................................................... 31.2% $ 691 $ 663
Clearwire Investment . . ............................................... 4.9% 207 167
Other............................................................. 53 40
Total equity-method investments .......................................... 951 870
Other investments ..................................................... 24 25
Total investments...................................................... $ 975 $ 895
For the year ended December 31, 2009, the Company recognized losses from equity-method investments of $49 million and, for the
years ended December 31, 2008 and 2007, recognized income from equity-method investments of $16 million and $11 million,
respectively, which is included in other income (expense), net, in the consolidated statement of operations.
SpectrumCo Joint Venture
TWC is a participant in a joint venture with certain other cable companies (“SpectrumCo”) that holds advanced wireless spectrum
(“AWS”) licenses. Under certain circumstances, the members of SpectrumCo have the ability to exit the venture and receive from the
venture, subject to certain limitations and adjustments, AWS licenses covering the areas in which they provide cable services. In January
2009, SpectrumCo redeemed the 10.9% interest held by an affiliate of Cox Communications, Inc. (“Cox”) and Cox received AWS
licenses, principally covering areas in which Cox provides cable services, and approximately $70 million in cash. This transaction closed
in January 2009 and TWC contributed $22 million to SpectrumCo to satisfy the Company’s funding obligations under the agreement.
Following the closing of this transaction, SpectrumCo’s AWS licenses cover 20 MHz over 80% of the continental U.S. and Hawaii.
81
TIME WARNER CABLE INC.
NOTES TO CONSOLIDATED FINANCIAL STATEMENTS—(Continued)