Time Warner Cable 2009 Annual Report Download - page 56
Download and view the complete annual report
Please find page 56 of the 2009 Time Warner Cable annual report below. You can navigate through the pages in the report by either clicking on the pages listed below, or by using the keyword search tool below to find specific information within the annual report.-
 1
1 -
2
-
3
-
4
-
5
-
6
-
7
-
8
-
9
-
10
-
11
-
12
-
13
-
14
-
15
-
16
-
17
-
18
-
19
-
20
-
21
-
22
-
23
-
24
-
25
-
26
-
27
-
28
-
29
-
30
-
31
-
32
-
33
-
34
-
35
-
36
-
37
-
38
-
39
-
40
-
41
-
42
-
43
-
44
-
45
-
 46
46 -
 47
47 -
 48
48 -
 49
49 -
 50
50 -
 51
51 -
 52
52 -
 53
53 -
 54
54 -
 55
55 -
 56
56 -
 57
57 -
 58
58 -
 59
59 -
 60
60 -
 61
61 -
 62
62 -
 63
63 -
 64
64 -
 65
65 -
 66
66 -
67
-
68
-
69
-
70
-
71
-
72
-
73
-
74
-
75
-
76
-
77
-
78
-
79
-
80
-
81
-
82
-
83
-
84
-
85
-
86
-
87
-
88
-
89
-
90
-
91
-
92
-
93
-
94
-
95
-
96
-
97
-
98
-
99
-
100
-
101
-
102
-
103
-
104
-
105
-
106
-
107
-
108
-
109
-
110
-
111
-
112
-
113
-
114
-
115
-
116
-
117
-
118
-
119
-
120
-
121
-
122
-
123
-
124
-
125
-
126
-
127
-
128
 |
 |

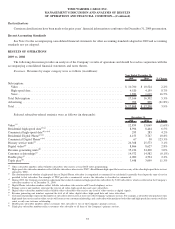
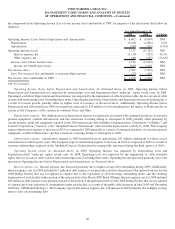
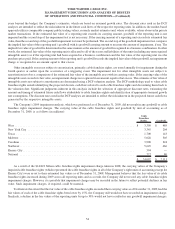
Selling, general and administrative expenses. The major components of selling, general and administrative expenses were as
follows (in millions):
2008 2007 % Change
Year Ended December 31,
Employee ............................................................... $ 1,146 $ 1,059 8.2%
Marketing ............................................................... 569 499 14.0%
Other .................................................................. 1,139 1,090 4.5%
Total ................................................................... $ 2,854 $ 2,648 7.8%
Selling, general and administrative expenses increased primarily due to higher employee and marketing costs. Employee costs
increased primarily due to headcount and salary increases and marketing costs increased primarily due to intensified marketing efforts.
Other costs in 2008 included a benefit of approximately $16 million due to changes in estimates of previously established casualty
insurance accruals. Excluding this benefit, other costs increased primarily due to higher miscellaneous administrative costs.
Merger-related and restructuring costs. The results for 2008 and 2007 included restructuring costs of $15 million and $13 million,
respectively. In addition, during 2007, the Company expensed non-capitalizable merger-related costs associated with the Adelphia/
Comcast Transactions of $10 million.
Impairment of cable franchise rights. During the fourth quarter of 2008, the Company recorded a noncash impairment charge of
$14.822 billion to reduce the carrying value of its cable franchise rights as a result of its annual impairment testing of goodwill and
indefinite-lived intangible assets.
Loss on sale of cable systems. During 2008, the Company recorded a loss of $58 million as a result of the sale of certain non-core
cable systems, which closed in December 2008.
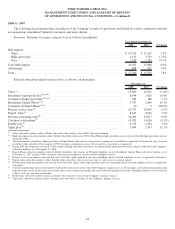
Reconciliation of Operating Income (Loss) before Depreciation and Amortization to Operating Income (Loss). The following table
reconciles Operating Income (Loss) before Depreciation and Amortization to Operating Income (Loss). In addition, the table provides
the components from Operating Income (Loss) to net income (loss) attributable to TWC for purposes of the discussions that follow (in
millions):
2008 2007 % Change
Year Ended December 31,
Operating Income (Loss) before Depreciation and Amortization ....................... $ (8,694) $ 5,742 NM
Depreciation ........................................................... (2,826) (2,704) 4.5%
Amortization .......................................................... (262) (272) (3.7%)
Operating Income (Loss) ................................................... (11,782) 2,766 NM
Interest expense, net ................................................... (923) (894) 3.2%
Other income (expense), net ............................................. (367) 156 NM
Income (loss) before income taxes........................................... (13,072) 2,028 NM
Income tax benefit (provision) ............................................ 5,109 (806) NM
Net income (loss) ......................................................... (7,963) 1,222 NM
Less: Net (income) loss attributable to noncontrolling interests ...................... 619 (99) NM
Net income (loss) attributable to TWC ......................................... $ (7,344) $ 1,123 NM
NM—Not meaningful.
Operating Income (Loss) before Depreciation and Amortization. As discussed above, in 2008, Operating Loss before Depreciation
and Amortization was impacted by the impairment of cable franchise rights, the loss on sale of cable systems and restructuring costs. In
2007, Operating Income before Depreciation and Amortization was impacted by merger-related and restructuring costs. Excluding these
items, Operating Income before Depreciation and Amortization increased principally as a result of revenue growth (particularly in high
margin high-speed data revenues), partially offset by higher costs of revenues and selling, general and administrative expenses.
Additionally, Operating Income before Depreciation and Amortization in 2008 was negatively impacted by $14 million of costs resulting
from the impact of Hurricane Ike on certain of the Company’s cable systems in southeast Texas and Ohio.
44
TIME WARNER CABLE INC.
MANAGEMENT’S DISCUSSION AND ANALYSIS OF RESULTS
OF OPERATIONS AND FINANCIAL CONDITION—(Continued)