Time Warner Cable 2009 Annual Report Download - page 54
Download and view the complete annual report
Please find page 54 of the 2009 Time Warner Cable annual report below. You can navigate through the pages in the report by either clicking on the pages listed below, or by using the keyword search tool below to find specific information within the annual report.-
 1
1 -
2
-
3
-
4
-
5
-
6
-
7
-
8
-
9
-
10
-
11
-
12
-
13
-
14
-
15
-
16
-
17
-
18
-
19
-
20
-
21
-
22
-
23
-
24
-
25
-
26
-
27
-
28
-
29
-
30
-
31
-
32
-
33
-
34
-
35
-
36
-
37
-
38
-
39
-
40
-
41
-
42
-
43
-
 44
44 -
 45
45 -
 46
46 -
 47
47 -
 48
48 -
 49
49 -
 50
50 -
 51
51 -
 52
52 -
 53
53 -
 54
54 -
 55
55 -
 56
56 -
 57
57 -
 58
58 -
 59
59 -
 60
60 -
 61
61 -
 62
62 -
 63
63 -
 64
64 -
65
-
66
-
67
-
68
-
69
-
70
-
71
-
72
-
73
-
74
-
75
-
76
-
77
-
78
-
79
-
80
-
81
-
82
-
83
-
84
-
85
-
86
-
87
-
88
-
89
-
90
-
91
-
92
-
93
-
94
-
95
-
96
-
97
-
98
-
99
-
100
-
101
-
102
-
103
-
104
-
105
-
106
-
107
-
108
-
109
-
110
-
111
-
112
-
113
-
114
-
115
-
116
-
117
-
118
-
119
-
120
-
121
-
122
-
123
-
124
-
125
-
126
-
127
-
128
 |
 |

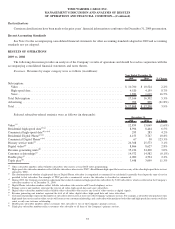
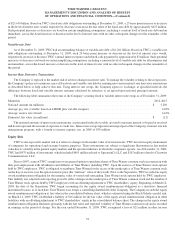
2008 vs. 2007
The following discussion provides an analysis of the Company’s results of operations and should be read in conjunction with the
accompanying consolidated financial statements and notes thereto.
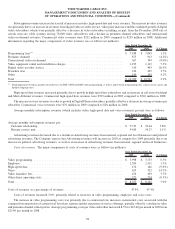
Revenues. Revenues by major category were as follows (in millions):
2008 2007 % Change
Year Ended December 31,
Subscription:
Video ................................................................ $ 10,524 $ 10,165 3.5%
High-speed data ......................................................... 4,159 3,730 11.5%
Voice................................................................. 1,619 1,193 35.7%
Total Subscription ......................................................... 16,302 15,088 8.0%
Advertising .............................................................. 898 867 3.6%
Total ................................................................... $ 17,200 $ 15,955 7.8%
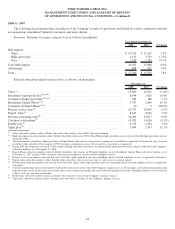
Selected subscriber-related statistics were as follows (in thousands):
2008 2007 % Change
December 31,
Video
(a)
................................................................. 13,069 13,251 (1.4%)
Residential high-speed data
(b)(c)(d)
............................................. 8,444 7,620 10.8%
Commercial high-speed data
(b)(c)(d)
............................................. 283 280 1.1%
Residential Digital Phone
(c)(e)
................................................ 3,747 2,890 29.7%
Commercial Digital Phone
(c)(e)
................................................ 30 5 500.0%
Primary service units
(f)
..................................................... 25,573 24,055 6.3%
Digital video
(g)
........................................................... 8,627 8,022 7.5%
Revenue generating units
(h)
.................................................. 34,200 32,077 6.6%
Customer relationships
(i)
.................................................... 14,582 14,626 (0.3%)
Double play
(j)
............................................................ 4,794 4,703 1.9%
Triple play
(k)
............................................................. 3,099 2,363 31.1%
(a)
Video subscriber numbers reflect billable subscribers who receive at least BST video programming.
(b)
High-speed data subscriber numbers reflect billable subscribers who receive TWC’s Road Runner high-speed data service or any of the other high-speed data services
offered by TWC.
(c)
The determination of whether a high-speed data or Digital Phone subscriber is categorized as commercial or residential is generally based upon the type of service
provided to that subscriber. For example, if TWC provides a commercial service, the subscriber is classified as commercial.
(d)
During 2008, the Company reclassified 15,000 commercial high-speed data subscribers to residential high-speed data subscribers, which is reflected in the Company’s
subscriber numbers as of December 31, 2008.
(e)
Digital Phone subscriber numbers reflect billable subscribers who receive an IP-based telephony service. Residential Digital Phone subscriber numbers as of
December 31, 2007 exclude 9,000 subscribers who received traditional, circuit-switched telephone service.
(f)
Primary service unit numbers represent the total of all video, high-speed data and voice (including circuit-switched telephone service, as applicable) subscribers.
(g)
Digital video subscriber numbers reflect billable video subscribers who receive any level of video service as digital signals.
(h)
Revenue generating unit numbers represent the total of all video, digital video, high-speed data and voice (including circuit-switched telephone service, as applicable)
subscribers.
(i)
Customer relationships represent the number of subscribers who receive at least one of the Company’s primary services. For example, a subscriber who purchases only
high-speed data service and no video service will count as one customer relationship, and a subscriber who purchases both video and high-speed data services will also
count as only one customer relationship.
(j)
Double play subscriber numbers reflect customers who subscribe to two of the Company’s primary services.
(k)
Triple play subscriber numbers reflect customers who subscribe to all three of the Company’s primary services.
42
TIME WARNER CABLE INC.
MANAGEMENT’S DISCUSSION AND ANALYSIS OF RESULTS
OF OPERATIONS AND FINANCIAL CONDITION—(Continued)