Time Warner Cable 2009 Annual Report Download - page 48
Download and view the complete annual report
Please find page 48 of the 2009 Time Warner Cable annual report below. You can navigate through the pages in the report by either clicking on the pages listed below, or by using the keyword search tool below to find specific information within the annual report.Use of Operating Income (Loss) before Depreciation and Amortization and Free Cash Flow
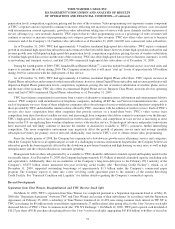
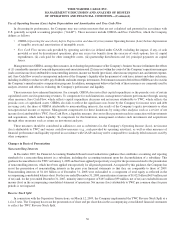
In discussing its performance, the Company may use certain measures that are not calculated and presented in accordance with
U.S. generally accepted accounting principles (“GAAP”). These measures include OIBDA and Free Cash Flow, which the Company
defines as follows:
•OIBDA (Operating Income (Loss) before Depreciation and Amortization) means Operating Income (Loss) before depreciation
of tangible assets and amortization of intangible assets.
•Free Cash Flow means cash provided by operating activities (as defined under GAAP) excluding the impact, if any, of cash
provided or used by discontinued operations, plus any excess tax benefits from the exercise of stock options, less (i) capital
expenditures, (ii) cash paid for other intangible assets, (iii) partnership distributions and (iv) principal payments on capital
leases.
Management uses OIBDA, among other measures, in evaluating the performance of the Company’s business because it eliminates the effects
of (1) considerable amounts of noncash depreciation and amortization and (2) items not within the control of the Company’s operations managers
(such as net income (loss) attributable to noncontrolling interests, income tax benefit (provision), other income (expense), net, and interest expense,
net). Free Cash Flow is used as an important indicator of the Company’s liquidity after the payment of cash taxes, interest and other cash items,
including its ability to reduce net debt, pay dividends and make strategic investments. Performance measures derived from OIBDA are also used in
the Company’s annual incentive compensation programs. In addition, management believes that both of these measures are commonly used by
analysts, investors and others in evaluating the Company’s performance and liquidity.
These measures have inherent limitations. For example, OIBDA does not reflect capital expenditures or the periodic costs of certain
capitalized assets used in generating revenues. To compensate for such limitations, management evaluates performance through, among
other measures, Free Cash Flow, which reflects capital expenditure decisions and net income attributable to TWC, which reflects the
periodic costs of capitalized assets. OIBDA also fails to reflect the significant costs borne by the Company for income taxes and debt
servicing costs, the share of OIBDA attributable to noncontrolling interests, the results of the Company’s equity investments or other
non-operational income or expense. Management compensates for these limitations by using other analytics such as a review of net
income (loss) attributable to TWC. Free Cash Flow, a liquidity measure, does not reflect payments made in connection with investments
and acquisitions, which reduce liquidity. To compensate for this limitation, management evaluates such investments and acquisitions
through other measures such as return on investment analyses.
These measures should be considered in addition to, not as substitutes for, the Company’s Operating Income (Loss), net income
(loss) attributable to TWC and various cash flow measures (e.g., cash provided by operating activities), as well as other measures of
financial performance and liquidity reported in accordance with GAAP, and may not be comparable to similarly titled measures used by
other companies.
Changes in Basis of Presentation
Noncontrolling Interests
In December 2007, the Financial Accounting Standards Board issued authoritative guidance that establishes accounting and reporting
standards for a noncontrolling interest in a subsidiary, including the accounting treatment upon the deconsolidation of a subsidiary. This
guidance became effective for TWC on January 1, 2009 and has been applied prospectively, except for the provisions related to the presentation
of noncontrolling interests, which have been applied retrospectively for all periods presented. As required by this guidance, the Company has
recast the presentation of noncontrolling interests in the prior year financial statements so that they are comparable to those of 2009.
Noncontrolling interests of $1.110 billion as of December 31, 2008 were reclassified to a component of total equity as reflected in the
accompanying consolidated balance sheet. For the year ended December 31, 2008, minority interest income of $1.022 billion ($619 million, net
of tax) and, for the year ended December 31, 2007, minority interest expense of $165 million ($99 million, net of tax) are excluded from net
income (loss) in the accompanying consolidated statement of operations. Net income (loss) attributable to TWC per common share for prior
periods is not impacted.
Reverse Stock Split
In connection with the Separation Transactions, on March 12, 2009, the Company implemented the TWC Reverse Stock Split at a
1-for-3 ratio. The Company has recast the presentation of share and per share data in the accompanying consolidated financial statements
to reflect the TWC Reverse Stock Split.
36
TIME WARNER CABLE INC.
MANAGEMENT’S DISCUSSION AND ANALYSIS OF RESULTS
OF OPERATIONS AND FINANCIAL CONDITION—(Continued)


