Time Warner Cable 2009 Annual Report Download - page 70
Download and view the complete annual report
Please find page 70 of the 2009 Time Warner Cable annual report below. You can navigate through the pages in the report by either clicking on the pages listed below, or by using the keyword search tool below to find specific information within the annual report.-
 1
1 -
2
-
3
-
4
-
5
-
6
-
7
-
8
-
9
-
10
-
11
-
12
-
13
-
14
-
15
-
16
-
17
-
18
-
19
-
20
-
21
-
22
-
23
-
24
-
25
-
26
-
27
-
28
-
29
-
30
-
31
-
32
-
33
-
34
-
35
-
36
-
37
-
38
-
39
-
40
-
41
-
42
-
43
-
44
-
45
-
46
-
47
-
48
-
49
-
50
-
51
-
52
-
53
-
54
-
55
-
56
-
57
-
58
-
59
-
 60
60 -
 61
61 -
 62
62 -
 63
63 -
 64
64 -
 65
65 -
 66
66 -
 67
67 -
 68
68 -
 69
69 -
 70
70 -
 71
71 -
 72
72 -
 73
73 -
 74
74 -
 75
75 -
 76
76 -
 77
77 -
 78
78 -
 79
79 -
 80
80 -
81
-
82
-
83
-
84
-
85
-
86
-
87
-
88
-
89
-
90
-
91
-
92
-
93
-
94
-
95
-
96
-
97
-
98
-
99
-
100
-
101
-
102
-
103
-
104
-
105
-
106
-
107
-
108
-
109
-
110
-
111
-
112
-
113
-
114
-
115
-
116
-
117
-
118
-
119
-
120
-
121
-
122
-
123
-
124
-
125
-
126
-
127
-
128
 |
 |

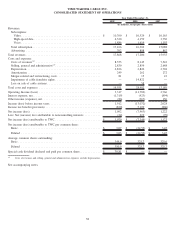
TIME WARNER CABLE INC.
CONSOLIDATED STATEMENT OF OPERATIONS
2009 2008 2007
Year Ended December 31,
(in millions, except per share data)
Revenues:
Subscription:
Video ................................................. $ 10,760 $ 10,524 $ 10,165
High-speed data . ........................................ 4,520 4,159 3,730
Voice ................................................. 1,886 1,619 1,193
Total subscription . . ........................................ 17,166 16,302 15,088
Advertising .............................................. 702 898 867
Total revenues .............................................. 17,868 17,200 15,955
Costs and expenses:
Costs of revenues
(a)
........................................ 8,555 8,145 7,542
Selling, general and administrative
(a)
............................ 2,830 2,854 2,648
Depreciation.............................................. 2,836 2,826 2,704
Amortization ............................................. 249 262 272
Merger-related and restructuring costs ........................... 81 15 23
Impairment of cable franchise rights ............................ — 14,822 —
Loss on sale of cable systems ................................. — 58 —
Total costs and expenses ...................................... 14,551 28,982 13,189
Operating Income (Loss) ...................................... 3,317 (11,782) 2,766
Interest expense, net . . ........................................ (1,319) (923) (894)
Other income (expense), net .................................... (86) (367) 156
Income (loss) before income taxes ............................... 1,912 (13,072) 2,028
Income tax benefit (provision) .................................. (820) 5,109 (806)
Net income (loss)............................................ 1,092 (7,963) 1,222
Less: Net (income) loss attributable to noncontrolling interests .......... (22) 619 (99)
Net income (loss) attributable to TWC ............................ $ 1,070 $ (7,344) $ 1,123
Net income (loss) attributable to TWC per common share:
Basic ................................................... $ 3.07 $ (22.55) $ 3.45
Diluted ................................................. $ 3.05 $ (22.55) $ 3.45
Average common shares outstanding:
Basic ................................................... 349.0 325.7 325.6
Diluted ................................................. 350.9 325.7 325.7
Special cash dividend declared and paid per common share ............. $ 30.81 $ — $ —
(a)
Costs of revenues and selling, general and administrative expenses exclude depreciation.
See accompanying notes.
58