Time Warner Cable 2009 Annual Report Download - page 55
Download and view the complete annual report
Please find page 55 of the 2009 Time Warner Cable annual report below. You can navigate through the pages in the report by either clicking on the pages listed below, or by using the keyword search tool below to find specific information within the annual report.-
 1
1 -
2
-
3
-
4
-
5
-
6
-
7
-
8
-
9
-
10
-
11
-
12
-
13
-
14
-
15
-
16
-
17
-
18
-
19
-
20
-
21
-
22
-
23
-
24
-
25
-
26
-
27
-
28
-
29
-
30
-
31
-
32
-
33
-
34
-
35
-
36
-
37
-
38
-
39
-
40
-
41
-
42
-
43
-
44
-
 45
45 -
 46
46 -
 47
47 -
 48
48 -
 49
49 -
 50
50 -
 51
51 -
 52
52 -
 53
53 -
 54
54 -
 55
55 -
 56
56 -
 57
57 -
 58
58 -
 59
59 -
 60
60 -
 61
61 -
 62
62 -
 63
63 -
 64
64 -
 65
65 -
66
-
67
-
68
-
69
-
70
-
71
-
72
-
73
-
74
-
75
-
76
-
77
-
78
-
79
-
80
-
81
-
82
-
83
-
84
-
85
-
86
-
87
-
88
-
89
-
90
-
91
-
92
-
93
-
94
-
95
-
96
-
97
-
98
-
99
-
100
-
101
-
102
-
103
-
104
-
105
-
106
-
107
-
108
-
109
-
110
-
111
-
112
-
113
-
114
-
115
-
116
-
117
-
118
-
119
-
120
-
121
-
122
-
123
-
124
-
125
-
126
-
127
-
128
 |
 |

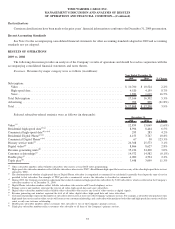
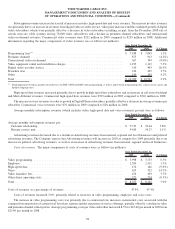
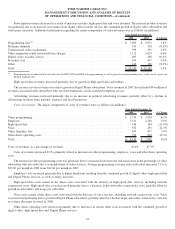
Subscription revenues increased as a result of increases in video, high-speed data and voice revenues. The increase in video revenues
was primarily due to an increase in revenues from digital video recorder service, the continued growth of digital video subscribers and
video price increases. Additional information regarding the major components of video revenues was as follows (in millions):
2008 2007 % Change
Year Ended December 31,
Programming tiers
(a)
....................................................... $ 7,095 $ 6,971 1.8%
Premium channels ......................................................... 913 918 (0.5%)
Transactional video-on-demand ............................................... 399 391 2.0%
Video equipment rental and installation charges ................................... 1,112 1,024 8.6%
Digital video recorder service ................................................ 403 268 50.4%
Franchise fees ............................................................ 459 437 5.0%
Other .................................................................. 143 156 (8.3%)
Total ................................................................... $ 10,524 $ 10,165 3.5%
(a)
Programming tier revenues include subscriber fees for BST, CPSTand DBT video programming, as well as genre-based programming tiers, such as movie, sports and
Spanish language tiers.
High-speed data revenues increased primarily due to growth in high-speed data subscribers.
The increase in voice revenues was due to growth in Digital Phone subscribers. Voice revenues in 2007 also included $34 million of
revenues associated with subscribers who received traditional, circuit-switched telephone service.
Advertising revenues increased primarily due to an increase in political advertising revenues, partially offset by a decline in
Advertising revenues from national, regional and local businesses.
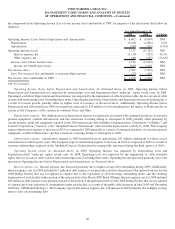
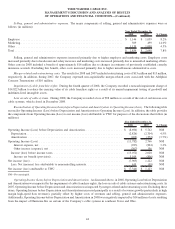
Costs of revenues. The major components of costs of revenues were as follows (in millions):
2008 2007 % Change
Year Ended December 31,
Video programming ........................................................ $ 3,753 $ 3,534 6.2%
Employee ............................................................... 2,511 2,348 6.9%
High-speed data........................................................... 146 164 (11.0%)
Voice .................................................................. 552 455 21.3%
Video franchise fees ....................................................... 459 437 5.0%
Other direct operating costs .................................................. 724 604 19.9%
Total ................................................................... $ 8,145 $ 7,542 8.0%
Costs of revenues as a percentage of revenues .................................... 47.4% 47.3%
Costs of revenues increased 8.0%, primarily related to increases in video programming, employee, voice and other direct operating
costs.
The increase in video programming costs was primarily due to contractual rate increases and an increase in the percentage of video
subscribers who also subscribe to expanded tiers of video services. Average programming costs per video subscriber increased 7.1% to
$23.60 per month in 2008 from $22.04 per month in 2007.
Employee costs increased primarily due to higher headcount resulting from the continued growth of digital video, high-speed data
and Digital Phone services, as well as salary increases.
High-speed data costs consist of the direct costs associated with the delivery of high-speed data services, including network
connectivity costs. High-speed data costs decreased primarily due to a decrease in per-subscriber connectivity costs, partially offset by
growth in subscribers and usage per subscriber.
Voice costs consist of the direct costs associated with the delivery of voice services, including network connectivity costs. Voice
costs increased primarily due to growth in Digital Phone subscribers, partially offset by a decline in per-subscriber connectivity costs due
to volume discounts received in 2008.
Other direct operating costs increased primarily due to increases in certain other costs associated with the continued growth of
digital video, high-speed data and Digital Phone services.
43
TIME WARNER CABLE INC.
MANAGEMENT’S DISCUSSION AND ANALYSIS OF RESULTS
OF OPERATIONS AND FINANCIAL CONDITION—(Continued)