Time Warner Cable 2009 Annual Report Download - page 113
Download and view the complete annual report
Please find page 113 of the 2009 Time Warner Cable annual report below. You can navigate through the pages in the report by either clicking on the pages listed below, or by using the keyword search tool below to find specific information within the annual report.-
 1
1 -
2
-
3
-
4
-
5
-
6
-
7
-
8
-
9
-
10
-
11
-
12
-
13
-
14
-
15
-
16
-
17
-
18
-
19
-
20
-
21
-
22
-
23
-
24
-
25
-
26
-
27
-
28
-
29
-
30
-
31
-
32
-
33
-
34
-
35
-
36
-
37
-
38
-
39
-
40
-
41
-
42
-
43
-
44
-
45
-
46
-
47
-
48
-
49
-
50
-
51
-
52
-
53
-
54
-
55
-
56
-
57
-
58
-
59
-
60
-
61
-
62
-
63
-
64
-
65
-
66
-
67
-
68
-
69
-
70
-
71
-
72
-
73
-
74
-
75
-
76
-
77
-
78
-
79
-
80
-
81
-
82
-
83
-
84
-
85
-
86
-
87
-
88
-
89
-
90
-
91
-
92
-
93
-
94
-
95
-
96
-
97
-
98
-
99
-
100
-
101
-
102
-
 103
103 -
 104
104 -
 105
105 -
 106
106 -
 107
107 -
 108
108 -
 109
109 -
 110
110 -
 111
111 -
 112
112 -
 113
113 -
 114
114 -
 115
115 -
 116
116 -
 117
117 -
 118
118 -
 119
119 -
 120
120 -
 121
121 -
 122
122 -
 123
123 -
124
-
125
-
126
-
127
-
128
 |
 |

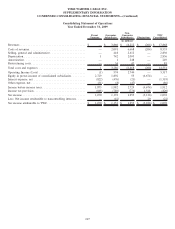
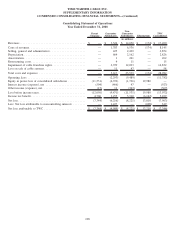
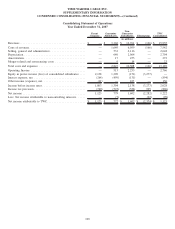
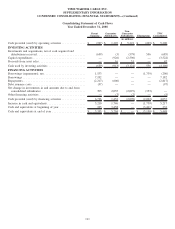
TIME WARNER CABLE INC.
SELECTED FINANCIAL INFORMATION
The selected financial information set forth below as of December 31, 2009 and 2008 and for the years ended December 31, 2009,
2008 and 2007 has been derived from and should be read in conjunction with the audited consolidated financial statements and other
financial information presented elsewhere herein. The selected financial information set forth below as of December 31, 2007, 2006 and
2005 and for the years ended December 31, 2006 and 2005 has been derived from audited consolidated financial statements not included
herein. Capitalized terms are as defined and described in the consolidated financial statements or elsewhere herein.
2009 2008 2007 2006 2005
Year Ended December 31,
(in millions, except per share data)
Selected Operating Statement Information:
(a)
Revenues:
Video . . . ............................................ $10,760 $ 10,524 $10,165 $ 7,632 $6,044
High-speed data . . ..................................... 4,520 4,159 3,730 2,756 1,997
Voice . . . ............................................ 1,886 1,619 1,193 715 272
Advertising ........................................... 702 898 867 664 499
Total revenues .......................................... 17,868 17,200 15,955 11,767 8,812
Total costs and expenses
(b)
................................. 14,551 28,982 13,189 9,588 7,026
Operating Income (Loss)
(b)
................................. 3,317 (11,782) 2,766 2,179 1,786
Interest expense, net . ..................................... (1,319) (923) (894) (646) (464)
Other income (expense), net
(c)
............................... (86) (367) 156 131 44
Income (loss) from continuing operations before income taxes ....... 1,912 (13,072) 2,028 1,664 1,366
Income tax benefit (provision) . .............................. (820) 5,109 (806) (645) (156)
Income (loss) from continuing operations ....................... 1,092 (7,963) 1,222 1,019 1,210
Discontinued operations, net of tax ........................... — — — 1,042 109
Cumulative effect of accounting change, net of tax
(d)
.............. — — — 2 —
Net income (loss) . . . ..................................... 1,092 (7,963) 1,222 2,063 1,319
Less: Net income (loss) attributable to noncontrolling interests ....... (22) 619 (99) (87) (66)
Net income (loss) attributable to TWC . . ....................... $ 1,070 $ (7,344) $ 1,123 $ 1,976 $1,253
Basic income (loss) from continuing operations attributable to TWC
per common share . ..................................... $ 3.07 $ (22.55) $ 3.45 $ 2.84 $ 3.45
Discontinued operations ................................... — — — 3.14 0.31
Cumulative effect of accounting change . ....................... — — — 0.01 —
Basic net income (loss) attributable to TWC per common share ...... $ 3.07 $ (22.55) $ 3.45 $ 5.99 $ 3.76
Diluted income (loss) from continuing operations attributable to TWC
per common share . ..................................... $ 3.05 $ (22.55) $ 3.45 $ 2.84 $ 3.45
Discontinued operations ................................... — — — 3.14 0.31
Cumulative effect of accounting change . ....................... — — — 0.01 —
Diluted net income (loss) attributable to TWC per common share . . . . . $ 3.05 $ (22.55) $ 3.45 $ 5.99 $ 3.76
Average common shares outstanding:
Basic ................................................. 349.0 325.7 325.6 330.1 333.3
Diluted ................................................ 350.9 325.7 325.7 330.1 333.3
101