Time Warner Cable 2009 Annual Report Download - page 124
Download and view the complete annual report
Please find page 124 of the 2009 Time Warner Cable annual report below. You can navigate through the pages in the report by either clicking on the pages listed below, or by using the keyword search tool below to find specific information within the annual report.-
 1
1 -
2
-
3
-
4
-
5
-
6
-
7
-
8
-
9
-
10
-
11
-
12
-
13
-
14
-
15
-
16
-
17
-
18
-
19
-
20
-
21
-
22
-
23
-
24
-
25
-
26
-
27
-
28
-
29
-
30
-
31
-
32
-
33
-
34
-
35
-
36
-
37
-
38
-
39
-
40
-
41
-
42
-
43
-
44
-
45
-
46
-
47
-
48
-
49
-
50
-
51
-
52
-
53
-
54
-
55
-
56
-
57
-
58
-
59
-
60
-
61
-
62
-
63
-
64
-
65
-
66
-
67
-
68
-
69
-
70
-
71
-
72
-
73
-
74
-
75
-
76
-
77
-
78
-
79
-
80
-
81
-
82
-
83
-
84
-
85
-
86
-
87
-
88
-
89
-
90
-
91
-
92
-
93
-
94
-
95
-
96
-
97
-
98
-
99
-
100
-
101
-
102
-
103
-
104
-
105
-
106
-
107
-
108
-
109
-
110
-
111
-
112
-
113
-
 114
114 -
 115
115 -
 116
116 -
 117
117 -
 118
118 -
 119
119 -
 120
120 -
 121
121 -
 122
122 -
 123
123 -
 124
124 -
 125
125 -
 126
126 -
 127
127 -
 128
128
 |
 |

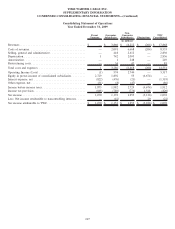
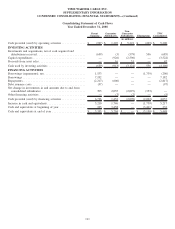
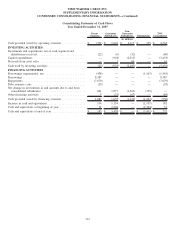
Consolidating Statement of Cash Flows
Year Ended December 31, 2007
Parent
Company
Guarantor
Subsidiaries
Non-
Guarantor
Subsidiaries Eliminations
TWC
Consolidated
(in millions)
Cash provided (used) by operating activities ............... $ (931) $ 1,022 $ 4,117 $ 355 $ 4,563
INVESTING ACTIVITIES
Investments and acquisitions, net of cash acquired and
distributions received .............................. (22) (6) (32) — (60)
Capital expenditures................................. — (918) (2,515) — (3,433)
Proceeds from asset sales ............................. — 1 60 — 61
Cash used by investing activities ....................... (22) (923) (2,487) — (3,432)
FINANCING ACTIVITIES
Borrowings (repayments), net .......................... (438) — — (1,107) (1,545)
Borrowings ....................................... 8,387 — — — 8,387
Repayments ....................................... (7,679) — — — (7,679)
Debt issuance costs ................................. (29) — — — (29)
Net change in investments in and amounts due to and from
consolidated subsidiaries ........................... 841 1,077 (1,563) (355) —
Other financing activities ............................. 5 (22) (67) — (84)
Cash provided (used) by financing activities ............... 1,087 1,055 (1,630) (1,462) (950)
Increase in cash and equivalents ........................ 134 1,154 — (1,107) 181
Cash and equivalents at beginning of year ................ 51 2,304 — (2,304) 51
Cash and equivalents at end of year ..................... $ 185 $ 3,458 $ — $ (3,411) $ 232
112
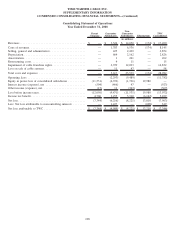
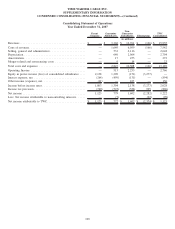
TIME WARNER CABLE INC.
SUPPLEMENTARY INFORMATION
CONDENSED CONSOLIDATING FINANCIAL STATEMENTS—(Continued)